Figures & data
Figure 1. Glutathione peroxidase activity of fat body (FB), gut (GT), and head (H) tissues of Rynchophorous phoenicis larva treated with varied concentration of DDVP solution.
Key: Control-larva treated with acetone in normal saline; D0.20-larva treated with 0.20 µg g−1 (w/v) DDVP; D0.30-larva treated with 0.30 µg g−1 (w/v); DDVP D0.40-larva treated with 0.40 µg g−1 (w/v); DDVP D0.50-larva treated with 0.50 µg g−1 (w/v); DDVP D0.60-larva treated with 0.60 µg g−1 (w/v) DDVP.
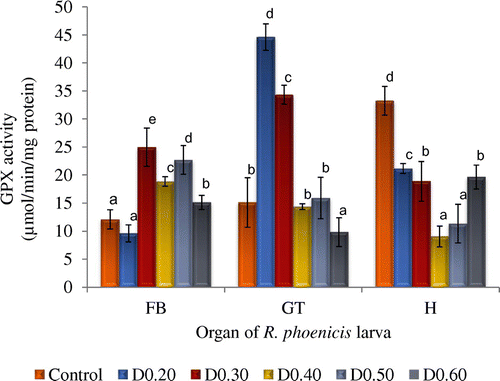
Figure 2. Glutathione reductase activity of fat body (FB), gut (GT), and head (H) tissues of Rynchophorous phoenicis larva treated with varied concentration of DDVP solution.
Key: Control-larva treated with acetone in normal saline; D0.20-larva treated with 0.20 µg g−1 (w/v) DDVP; D0.30-larva treated with 0.30 µg g−1 (w/v); DDVP D0.40-larva treated with 0.40 µg g−1 (w/v); DDVP D0.50-larva treated with 0.50 µg g−1 (w/v); DDVP D0.60-larva treated with 0.60 µg g−1 (w/v) DDVP.
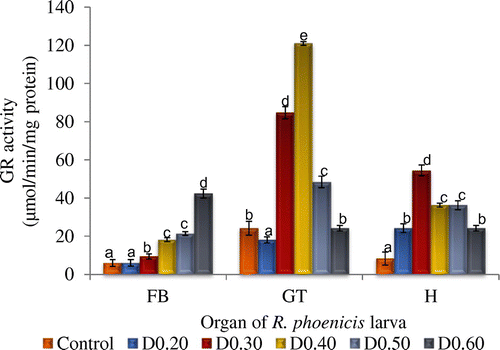
Figure 3. Glutathione transferase activity of fat body (FB), gut (GT), and head (H) tissues of Rynchophorous phoenicis larva treated with varied concentration of DDVP solution.
Key: Control-larva treated with acetone in normal saline; D0.20-larva treated with 0.20 µg g−1 (w/v) DDVP; D0.30-larva treated with 0.30 µg g−1 (w/v); DDVP D0.40-larva treated with 0.40 µg g−1 (w/v); DDVP D0.50-larva treated with 0.50 µg g−1 (w/v); DDVP D0.60-larva treated with 0.60 µg g−1 (w/v) DDVP.
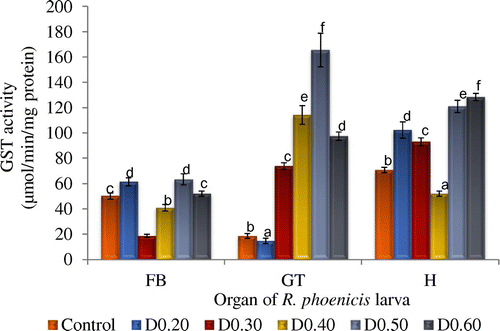
Figure 4. Time-course glutathione transferase activity (GST) in the gut tissue of Rynchophorous phoenicis larva.
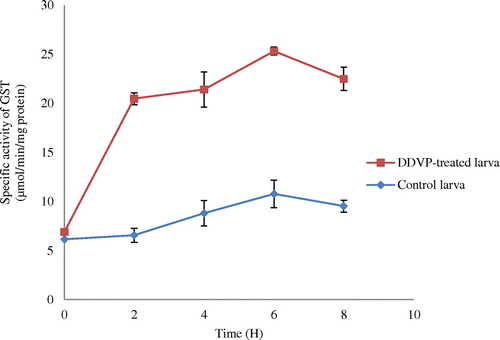
Figure 5. Gel profile of crude extracts of gut of DDVP-treated Rynchophorus phoenicis larva.
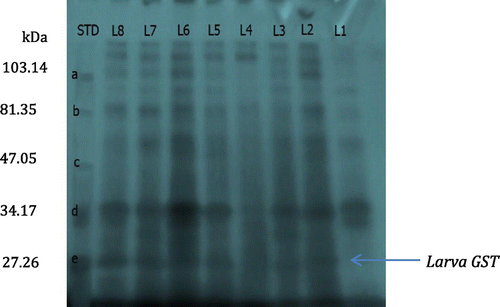
Figure 6. Elution profiles of glutathione transferase from the gut of (A) control R. phoenicis larva and (B) DDVP-treated R. phoenicis larva using ion exchange chromatography.
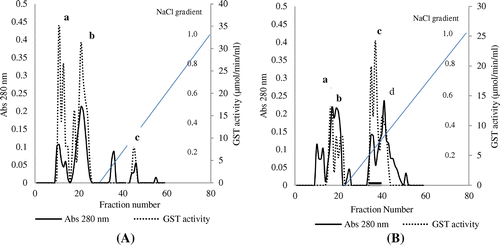
Figure 7. Elution profile of glutathione transferase on affinity chromatography-GSTrap 4B. Ion-exchange-purified enzyme was applied to a GSH-Sepharose 4B (1 × 1 cm) column previously equilibrated with PBS, pH 7.4.
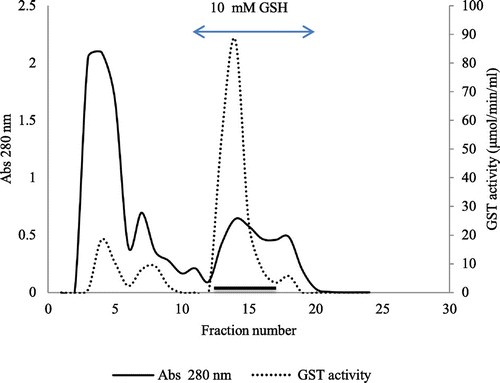
Table 1. Summary of purification of rplGSTc
Figure 8. Electrophorectograms of purified rplGSTc on (A) 10% polyacylamide gel slab at room temperature and (B) Native gel of 10% polyacrylamide.
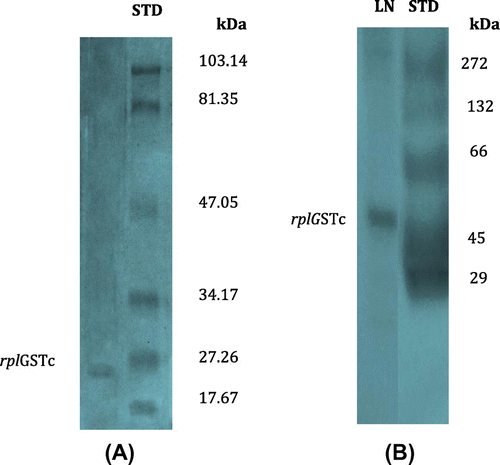
Figure 9. Double reciprocal plot of rplGSTc-catalyzed reaction. (A) Plots of 1/vo vs. 1/[CDNB] at constant varied concentrations of GSH. (a) Secondary plot: plots of intercept or slopes in (A) vs. 1/[GSH]. (B) Plots of 1/vo vs. 1/[GSH] at constant varied concentrations of CDNB. (b) Secondary plot: plots of intercepts or slopes in (B) vs. 1/[CDNB].
![Figure 9. Double reciprocal plot of rplGSTc-catalyzed reaction. (A) Plots of 1/vo vs. 1/[CDNB] at constant varied concentrations of GSH. (a) Secondary plot: plots of intercept or slopes in (A) vs. 1/[GSH]. (B) Plots of 1/vo vs. 1/[GSH] at constant varied concentrations of CDNB. (b) Secondary plot: plots of intercepts or slopes in (B) vs. 1/[CDNB].](/cms/asset/7228ddb0-36a7-415c-af19-79f26da15998/oabi_a_1286764_f0009_oc.gif)
