Figures & data
Table 1. Comprehensive list of the 24 protein groups and the six selected proteins for each group with the organism name, PDB ID, and number of amino acid residues (sequence length) in chain A of the protein
Table 2. The number of species studied (N), the sequence identity, structural similarity, and dynamic similarity (in terms of BC) of the 24 protein groups studied
Figure 1. The structure of E. coli methionine adenosyltransferase homodimer (1FUG) with the flexible gating loops shown in red and the active site residues in orange. The structure visualization was achieved with VMD.
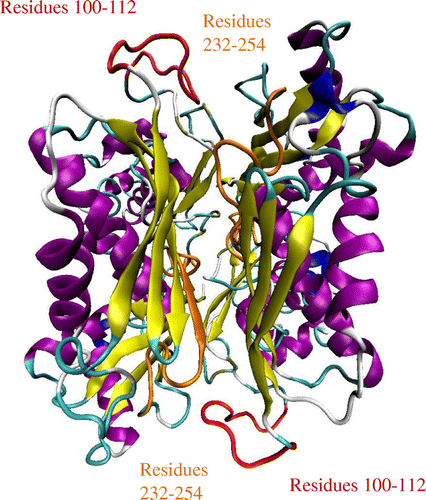
Figure 2. The Cα atom fluctuations of the E. coli methionine adenosyltransferase. The fluctuations describe the flexibility of Cα atoms of the enzyme.
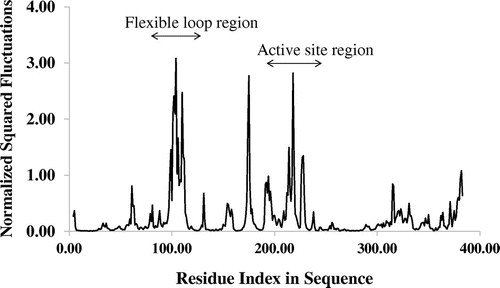
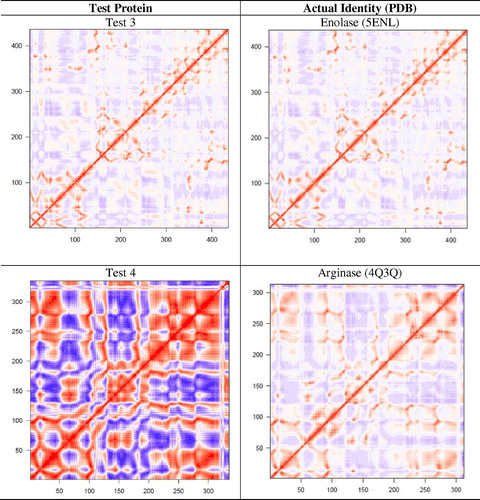
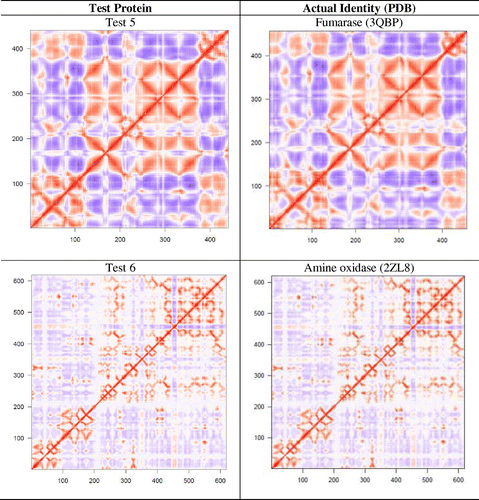
Figure 3. Dynamic cross-correlation matrices of six proteins in the methionine adenosyltransferase group with a color key depicting the correlated motions in red and anticorrelated motions in blue. The overall pattern remains consistent across all species within the group, apart from minute differences that are barely visible to the naked eye.
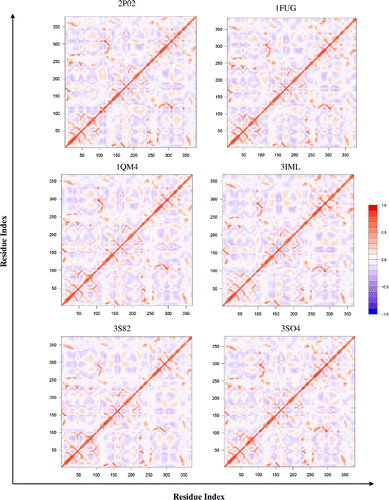
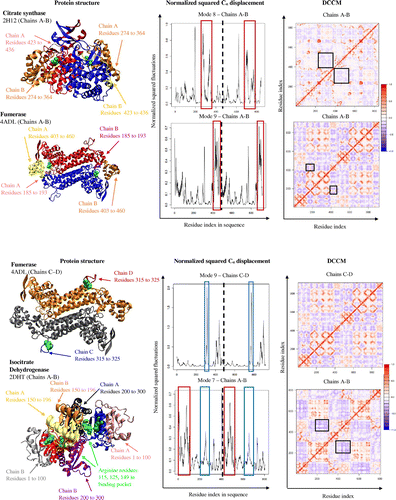
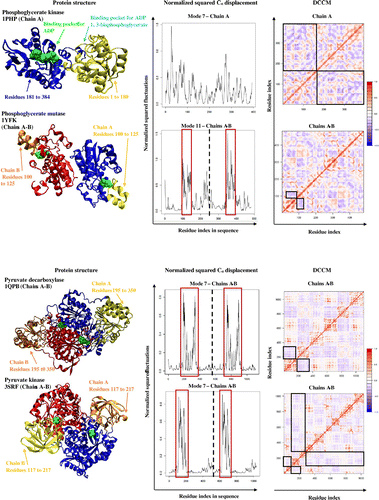
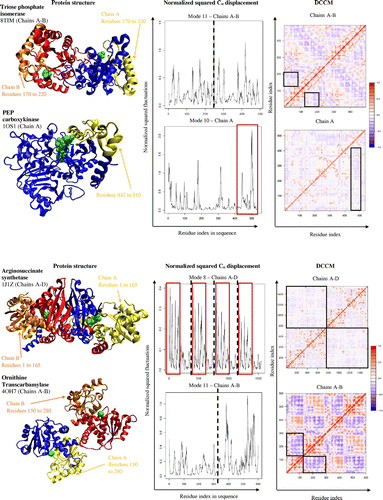
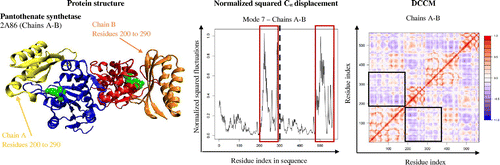
Table 3. A list of proteins with PDB codes, DCCM of the protein represented in bold, and the group BC heat map
Figure 4. A dynamic cross-correlation matrix for E. coli Methionine Adenosyltransferase (1FUG) showing the correlated (red) and anticorrelated (blue) motions between Cα atoms.
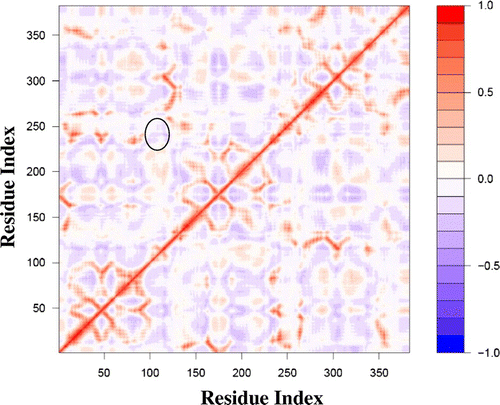
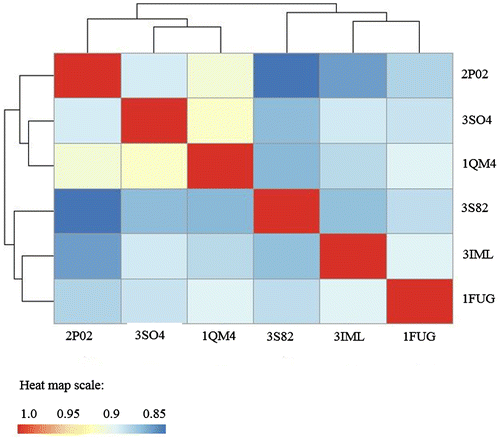
Figure 5. Methionine Adenosyltransferase heat map of BC showing the dynamic relatedness between proteins, with the color key at the bottom.