792
Views
0
CrossRef citations to date
0
Altmetric
Research Article

An efficient strategy for expression and purification of spider neurotoxic peptide YC1 in E. coli

, , , , & | (Reviewing Editor) show all
Article: 1317898 | Received 27 Feb 2017, Accepted 06 Apr 2017, Published online: 20 Apr 2017

Figures & data

Figure 1. Construction of pET-GST-YC1 expression vector. (A) The composition of the pET-GST-YC1 vector. (B) The amino acid sequences of ProTX II, GsAF II, and YC1.
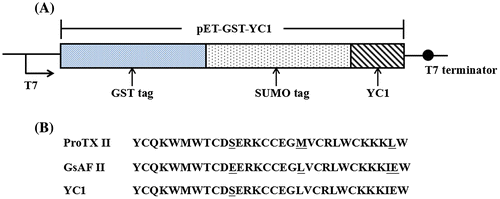
Figure 1. Construction of pET-GST-YC1 expression vector. (A) The composition of the pET-GST-YC1 vector. (B) The amino acid sequences of ProTX II, GsAF II, and YC1.

Figure 2. Expression of GST-YC1 in SHuffleTM.
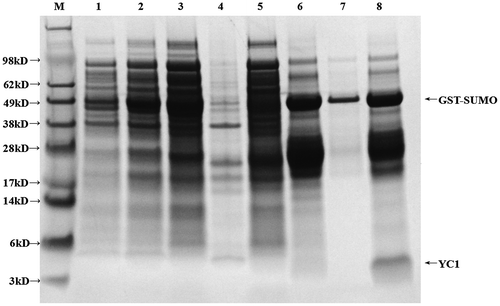
Notes: The protein was isolated by 10% glycine-SDS-PAGE and used for experiments as described in the Materials and Methods. Lane M, marker; lane 1, uninduced bacteria total cells protein using the ZYM-505 medium; lane 2, induced bacterial total cells protein using the ZYM-5051 medium; lane 3, the centrifuged supernatant after sonication (soluble fractions); lane 4, the centrifuged precipitate after sonication (insoluble fractions); lane 5, the flow through from the GST column; lane 6, the flow through from the GST column; lane 7, the fusion protein after ultrafiltration desalination; lane 8, the fusion protein after ULP1 cleavage. The arrow indicates GST-SUMO-YC1 (~49 kDa) and YC1 (~4 kDa).
Figure 2. Expression of GST-YC1 in SHuffleTM.

Figure 3. RP-HPLC chromatography of rYC1. (A) Absorption of the eluted proteins was measured at 280 nm, and fractions corresponding to detected peaks were collected. (B) Absorption of the eluting solution was measured at 215 nm, and fractions corresponding to detected peaks were collected.
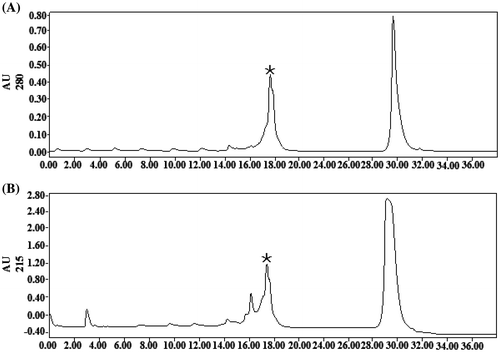
Figure 3. RP-HPLC chromatography of rYC1. (A) Absorption of the eluted proteins was measured at 280 nm, and fractions corresponding to detected peaks were collected. (B) Absorption of the eluting solution was measured at 215 nm, and fractions corresponding to detected peaks were collected.

Figure 4. Identification of rYC1. (A) The results of the glycine-SDS-PAGE analysis. Lane 1, protein from eluent marked with asterisk in Figure ; lane 2, the protein after the ultrafiltration purification of eluent marked with asterisk (Figure ). (B) Mass spectra of the rYC1. The calculated theoretical molecular weight of rYC1 was 3,937.7 Da, and the measured molecular weight was 3,939.9 Da,
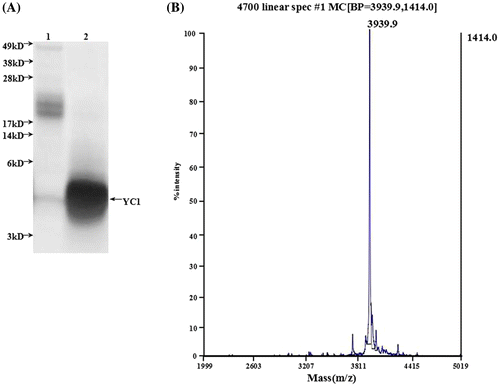
Figure 4. Identification of rYC1. (A) The results of the glycine-SDS-PAGE analysis. Lane 1, protein from eluent marked with asterisk in Figure 3; lane 2, the protein after the ultrafiltration purification of eluent marked with asterisk (Figure 3). (B) Mass spectra of the rYC1. The calculated theoretical molecular weight of rYC1 was 3,937.7 Da, and the measured molecular weight was 3,939.9 Da,
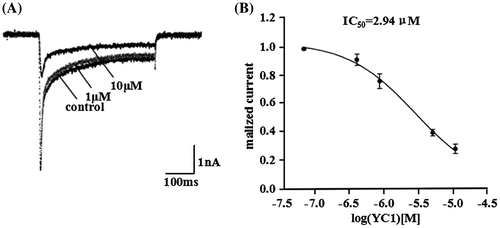
Figure 5. Inhibitory effects of rYC1 on the rNav 1.3 currents. (A) The inhibitory effects of 1 μM or 10 μM rYC1 on rNav1.3 current. (B) The effects of rYC1 on rNav1.3 channels expressed in HEK293 cells. The IC50 value of rYC1 for rNav1.3 was 2.94 μmol/L.

Figure 5. Inhibitory effects of rYC1 on the rNav 1.3 currents. (A) The inhibitory effects of 1 μM or 10 μM rYC1 on rNav1.3 current. (B) The effects of rYC1 on rNav1.3 channels expressed in HEK293 cells. The IC50 value of rYC1 for rNav1.3 was 2.94 μmol/L.