377
Views
0
CrossRef citations to date
0
Altmetric
Research Article

Mutual modulation of femarelle and vitamin D analog activities in human derived female cultured osteoblasts

, , , , & | (Reviewing Editor) show all
Article: 1374919 | Received 07 Sep 2016, Accepted 30 Aug 2017, Published online: 29 Sep 2017

Figures & data

Figure 1. Basal levels of DNA synthesis and CK specific activity in pre-menopausal (pre), in post-menopausal human osteoblasts (post) and male human cultured bone cells.
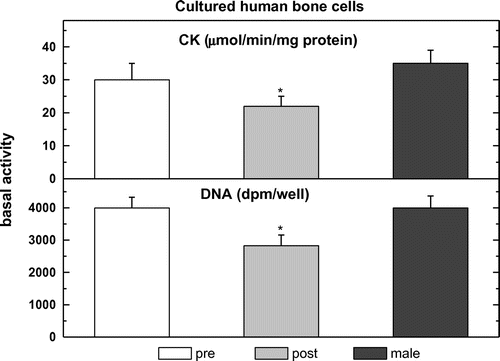
Notes: Bone cells were cultured, treated, and analyzed for DNA synthesis and CK specific activity as described in Materials. Results are means ± SEM for triplicate cultures from 5 humans/group. Experimental means were compared to control (vehicle alone) means: *p < 0.05, **p < 0.01.
Figure 1. Basal levels of DNA synthesis and CK specific activity in pre-menopausal (pre), in post-menopausal human osteoblasts (post) and male human cultured bone cells.

Figure 2. Stimulation of DNA synthesis or CK specific activity by F, D or E2 as well as JKF in hObs from pre- and post-menopausal women or male.
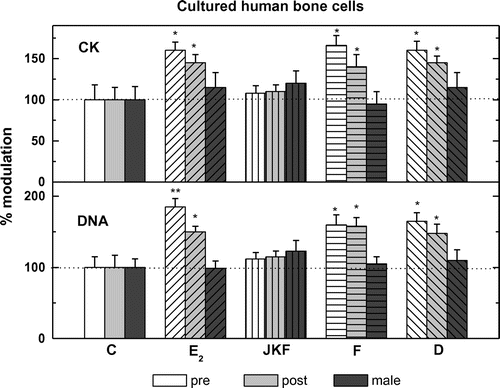
Notes: Cells were obtained, cultured, treated, and assayed as described in Materials and Methods. They were treated for 24 h with vehicle (C), 200 ng/ml F, 300nM D or 30nM E2 as well as 1nM JKF. Results are means ± SEM for cultures obtained from 3–5 women or male. Control means were 6,286 ± 675 and 5,824 ± 460 and 5,964 ± 575 dpm/well, for pre- and post-menopausal women and for male respectively. Experimental means compared to control means: *p < 0.01. For CK control means were 28.6 ± 6.5 and 24.6 ± 4.0 and 26.2 ± 5.7 nmol/min/mg protein, for pre- and post-menopausal women and for male respectively. Experimental means compared to control means: *p < 0.01.
Figure 2. Stimulation of DNA synthesis or CK specific activity by F, D or E2 as well as JKF in hObs from pre- and post-menopausal women or male.

Figure 3. Stimulation of DNA synthesis or CK specific activity by F, D, or E2 in hObs from pre- and post-menopausal women after pre-treatment with JKF (light gray bars).
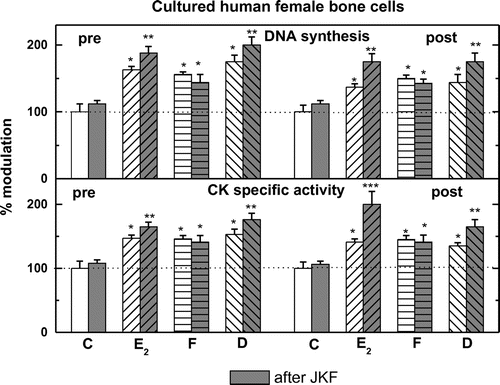
Notes: Cells were obtained, cultured, treated, and assayed as described in Materials and Methods. Cells were treated for 3 days by daily addition of 1nM JKF and then treated for 24 h with 200 ng/ml F, 300nM D or 30nM E2. Results are means cultures obtained from 5 women/group for JKF treated cultures and 10 women for control cultures. Control means were 6,286 ± 675 and 5,824 ±4 60 dpm/well, for pre- and post-menopausal women, respectively. Experimental means compared to control means: *p < 0.01; experimental means with JKF compared to experimental means with control: #p < 0.01; experimental means with JKF compared to experimental means with control: #p < 0.01.
Figure 3. Stimulation of DNA synthesis or CK specific activity by F, D, or E2 in hObs from pre- and post-menopausal women after pre-treatment with JKF (light gray bars).

Figure 4. The expression of estrogen receptors ERα and ERβ in pre-menopausal human osteoblasts (pre), in post-menopausal human osteoblasts (post) and human males (male).
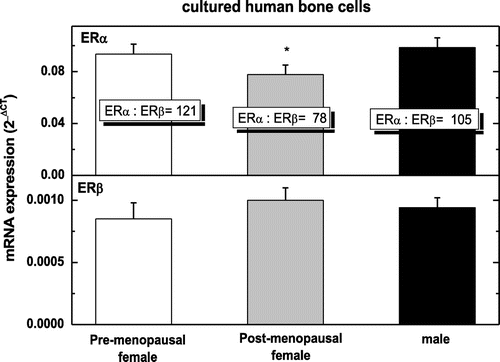
Notes: Bone cells were cultured, treated, and extracts prepared for mRNA expression as described in Materials and Methods. Results are means ± SEM for cultures from 5 humans/group.
Figure 4. The expression of estrogen receptors ERα and ERβ in pre-menopausal human osteoblasts (pre), in post-menopausal human osteoblasts (post) and human males (male).

Figure 5. Modulation by pre-treatment with E2, D, F or JKF on the expression of ER mRNA in hObs obtained from pre- and post-menopausal women.
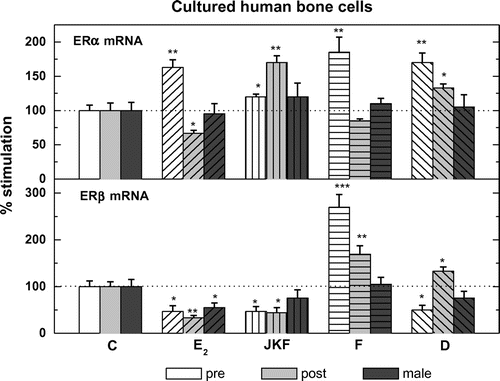
Notes: Bone cells were obtained, cultured, treated daily for 3 days with 20 ng/ml F, 30nM D or 3nME2 or 1nM JKF, and extracts prepared for analysis as described in Materials and Methods. Results are SEM for triplicate cultures from 5 donors for each group. Means of hormonal treated compared to means of vehicle-treated cells: *p < 0.01.
Figure 5. Modulation by pre-treatment with E2, D, F or JKF on the expression of ER mRNA in hObs obtained from pre- and post-menopausal women.

Figure 6. The effect of E2, D, F or JKF on intracellular binding of E2 in pre- or post-menopausal female hObs, as measured by competition of the binding of 3 [H] E2. The effects of treatment with JKF (3 days with 1nM) or E2, D and F on intracellular binding of E2 in pre- or post-menopausal female hObs, as measured by competition of the binding of 3 [H] E2.

Notes: Results are means of 4 donors for each group, and are expressed as % modulation of the binding in hormone treated cells compared to untreated cells. **p < 0.01.
Figure 6. The effect of E2, D, F or JKF on intracellular binding of E2 in pre- or post-menopausal female hObs, as measured by competition of the binding of 3 [H] E2. The effects of treatment with JKF (3 days with 1nM) or E2, D and F on intracellular binding of E2 in pre- or post-menopausal female hObs, as measured by competition of the binding of 3 [H] E2.

Figure 7. Modulation of the specific intracellular binding of 3 [H] E2 binding in pre-menopausal human osteoblasts (pre-), in post-menopausal human osteoblasts (post-) and males (male) by 30nM E2, 3,000 nM D or 200 ng/ml F after three daily treatments with 1nM JKF.

Notes: Bone cells were cultured, treated, and extracts prepared for binding activity as described in Materials and Methods. Results are means of 5 donors for each group and are means of experimental compared to control (vehicle alone) means: *p < 0.01.
Figure 7. Modulation of the specific intracellular binding of 3 [H] E2 binding in pre-menopausal human osteoblasts (pre-), in post-menopausal human osteoblasts (post-) and males (male) by 30nM E2, 3,000 nM D or 200 ng/ml F after three daily treatments with 1nM JKF.

Figure 8. The expression of VDR or 1OHase and 1,25D production in pre-menopausal human osteoblasts (pre-), in post-menopausal human osteoblasts (post-) and in human male osteoblasts (male).
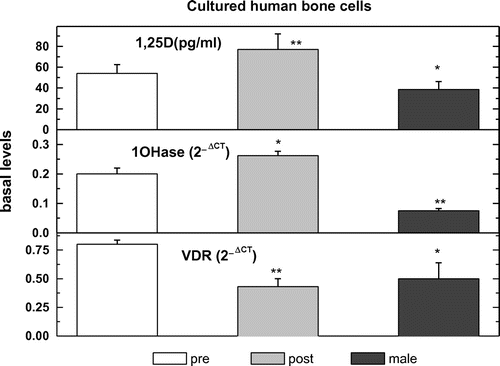
Notes: Bone cells were cultured, treated, and extracts prepared for mRNA expression as described in Materials ± SEM for cultures from 5 humans group.
Figure 8. The expression of VDR or 1OHase and 1,25D production in pre-menopausal human osteoblasts (pre-), in post-menopausal human osteoblasts (post-) and in human male osteoblasts (male).

Figure 9. The effects of treatment with E2, D, F, or JKF on 1,25D production (lower panel) and 1OHase mRNA expression (middle panel), as well as on VDR mRNA expression (upper panel) in pre- and post-menopausal and male hObs.
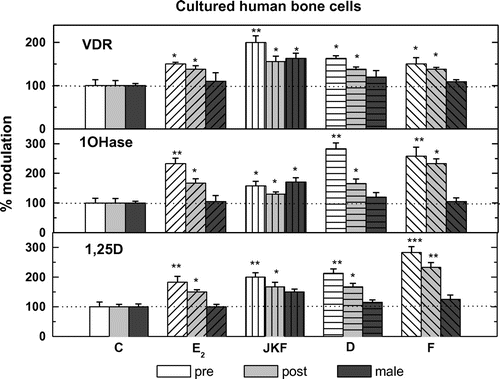
Notes: Cells were incubated for 24 h for the production of 1,25D or for 3 days for VDR and 1OHase mRNA expressions with F (20 ng/ml), D (30nM) or E2 (3nM) or JKF (1nM). Results are expressed as % change in the concentration of 1,25D (pg/mg protein) or in 1OHase and VDR mRNA expression quantified by real time PCR (n = 4–8 human/group). *p < 0.05; **p < 0.01.
Figure 9. The effects of treatment with E2, D, F, or JKF on 1,25D production (lower panel) and 1OHase mRNA expression (middle panel), as well as on VDR mRNA expression (upper panel) in pre- and post-menopausal and male hObs.