Figures & data
Figure 1. An illustration of the fusion mAb with insertion of ELP at the C-terminus (VPGXG119) of the heavy chain. Polar (20%) and charged (20%) residues were randomly interspersed among the hydrophobic (60%) residues to mitigate patches of hydrophobicity and charge on the fusion protein. A single-point mutation (H435C) was engineered in the heavy chain to disrupt binding to the neonatal receptor (depicted as X on HC).
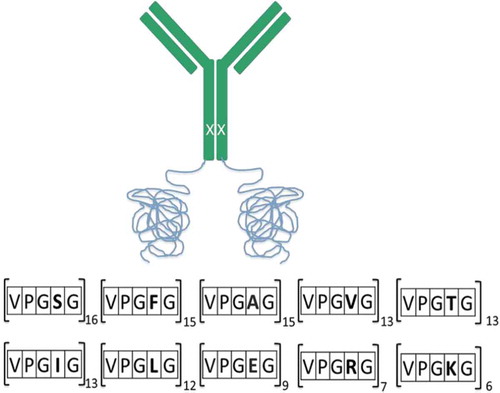
Figure 2. (a) SDS-PAGE gel with lanes 1–3 showing purity of the non-reduced fusion protein after each chromatography step. Lanes 5 and 6 show the fusion mAb and parental mAb, respectively, run under reducing conditions. (b) Size-exclusion chromatography (SEC) analysis of the fusion protein. The fusion protein was also incubated at 1:1 molar ratio with human TNFα and rerun on the SEC column. (c) Evaluation of the antibody and fusion protein hydrophobicity by hydrophobic-interaction chromatography (HIC) on a TOSOH Butyl-NPR column. (d) Evaluation of isoelectric point (pI) by imaged capillary isoelectric focusing (icIEF). (e) Use of sedimentation velocity, a solution based analytical methodology, to confirm the correct size of the fusion protein.
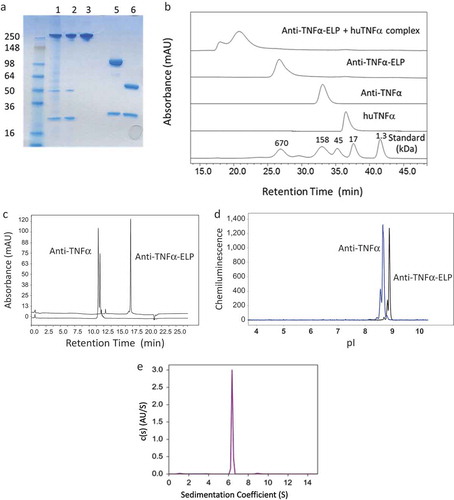
Figure 3. (a) DLS data were collected on a DynaPro Plate Reader. The anti-TNFα-ELP mAb concentration was at 0.5 mg/mL and temperature was steadily increased at 0.065°C/min. The temperature was also steadily decreased back to its start temperature of 25°C. (b) An illustration of possible transition states of the fusion protein.
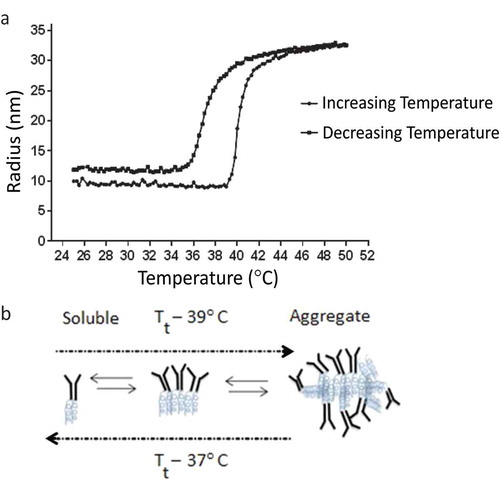
Table 1. Differential scanning calorimetry studies on parent anti-TNFα and anti-TNFα-ELP fusion mAb
Figure 4. Representative DSC scan for the anti-TNFα-ELP fusion mAb. Analysis was performed on a MicroCal VP-DSC instrument. Samples were diluted to 0.5–1 mg/mL in PBS buffer pH 7.4 and subjected to a temperature ramp from 25°C to 90°C at a rate of 1°C/min. The assignments of CH2, CH3, and Fab domains are based on literature and not confirmed using independently purified domains.
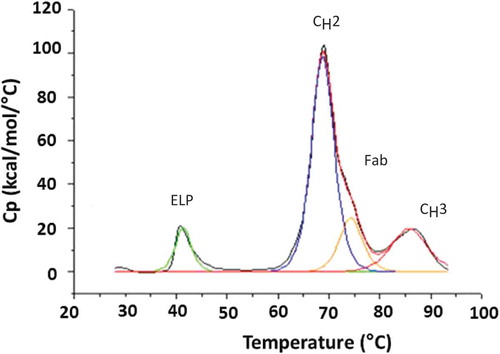
Table 2. Surface plasmon resonance for the binding of anti-TNFα and anti-TNFα-ELP fusion mAb to human TNFα
Figure 5. Sensorgram for binding of anti-TNFα antibodies to recombinant human TNFα obtained on a Biacore T200 instrument. (a) and (d) *Stable complex were formed at 40°C before measuring affinity at RT. (c) and (f) **Stable complex formed at 40°C and then kept for 7 days at RT before measuring affinity. Goat anti-human IgG Fc antibodies were immobilized via amino coupling on the chip surface. Antibodies, diluted to a concentration of ~ 0.5 − 1.0 µg/mL in HBS-EP+ buffer, were captured on flow cell and recombinant human TNFα injected for 5 min at a flow rate of 50 µL/min with continuous flow of the running buffer at a flow rate of 50 µL/min. Biacore T200 Evaluation Software version 2.0 was used to fit the data from the TNF binding studies to a 1:1 kinetic model.
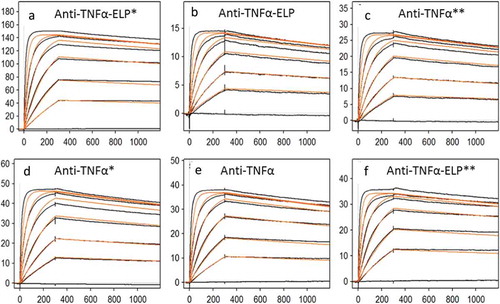
Table 3. In-vitro bioactivity data (IC50) of parent anti-TNFα or anti-TNFα-ELP fusion mAb assessed against human or cyno TNFα-mediated L929 cytotoxicity
Figure 6. Neutralizing assay on TNFα induced cytotoxicity in mouse L929 cells: Anti-TNFα-ELP fusion mAb and anti-TNFα mAb were serially diluted and pre-incubated with recombinant human TNFα (2.9 × 10⁻¹² M final concentration). The pre-incubated samples were added to the murine fibrosarcoma cell line L929. Viability was quantified using WST-1 reagent. The plates were read at OD 420–600 nm on a Spectramax 190 ELISA plate reader (Molecular Devices, Sunnyvale, CA). The IC50 value was determined by plotting the OD420–600 values vs. the concentration of mAb-ELP using a non-linear four parameter curve fit using Graphpad Prism 5.
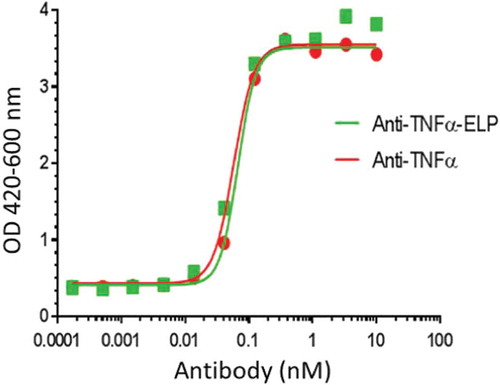
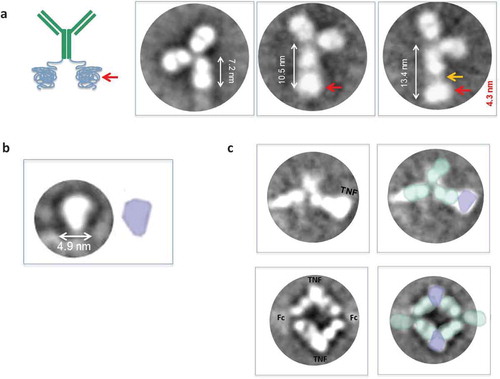
Figure 7. (a) Exemplary class averages (>200) denoted with possible interpretations of structure and orientation. Many class averages show a typical Fc size of about 7 nm. However some averages show a longer ~10–13 nm Fc with a clear additional area of density after the Fc (red arrow) that most likely corresponds to the elastin attached to the Fc. The additional area of density can appear immediately adjacent to the Fc or at a slight distance and connected by weak density (orange arrow). (b) Exemplary class averages of human TNFα show a typical size of about 4.9 nm. (c) Exemplary class averages of anti-TNFα-ELP fusion mAb incubated with huTNF-α showed particles that resembled dimers with two antibodies bound to two TNFα trimers; facing each other Fab to Fab in a diamond formation and some averages that resembled an antibody monomer bound to TNFα. The Fc portion of the antibodies was not clearly visible and resembled a faint blur; most likely due to the high flexibility of the Fc.