Figures & data
Figure 1. The work flow for saliva samples collection and storage.
Saliva samples were collected in 50 mL Falcon tube and aliquoted into 1.5 mL Eppendorf tubes. Saliva preservation buffer (Mawi Cell Stabilization, MCS) was added to (a), (b) and (c) while 1× PBS was added to (d), (e) and (f) as mock. Samples (a) and (d) were used as baseline; samples (b) and (e) were incubated in room temperature for 24 h; samples (c) and (f) were incubated in room temperature for a week.
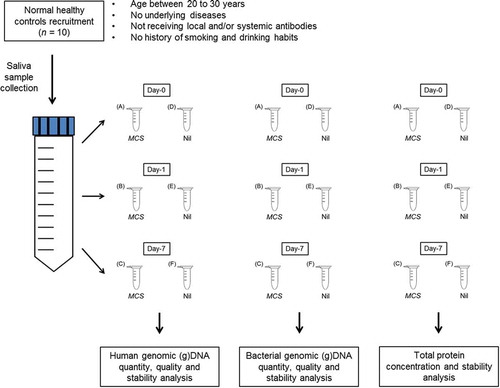
Figure 2. The scatter plots represents the human gDNA concentration and the mean threshold cycle (Ct) for human β-globin gene from saliva samples with (a and c) and without (b and c) MCS buffer at Day-0 (baseline), Day-1 and Day-7 at room temperature.
Significant differences are denoted with * = P < 0.05, ** = P < 0.01, *** = P < 0.001, **** = P < 0.0001, respectively.
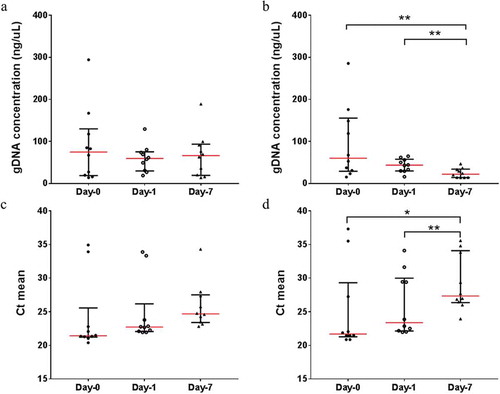
Figure 3. The scatter plots represent the bacterial gDNA concentration and the mean threshold cycle (Ct) for bacterial 16S rRNA gene from saliva samples with (a and c) and without (b and c) MCS buffer at Day-0 (baseline), Day-1 and Day-7 at room temperature.
Significant differences are denoted with * = P < 0.05, ** = P < 0.01, *** = P < 0.001, **** = P < 0.0001, respectively.
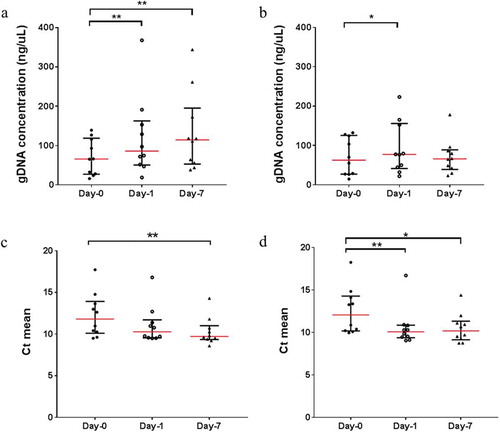
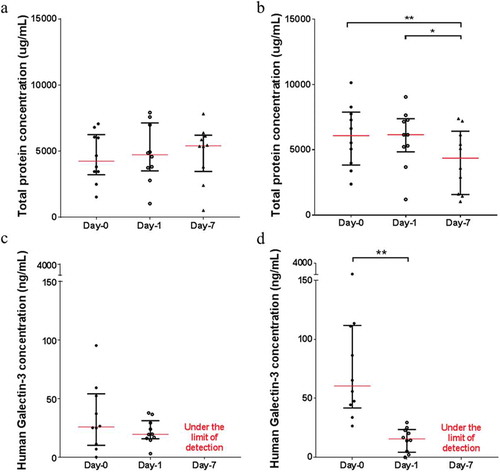
Figure 4. The scatter plots represent the total protein level and human Galectin-3 concentration from saliva samples with (a and c) and without (b and c) MCS buffer at Day-0 (base-line), Day-1 and Day-7 at room temperature.
Significant differences are denoted with * = P < 0.05, ** = P < 0.01, *** = P < 0.001, **** = P < 0.0001, respectively.