Figures & data
Figure 1. Serum cortisol level in female and male O. mossambicus.
Note: Significance is reported at *p < 0.05.
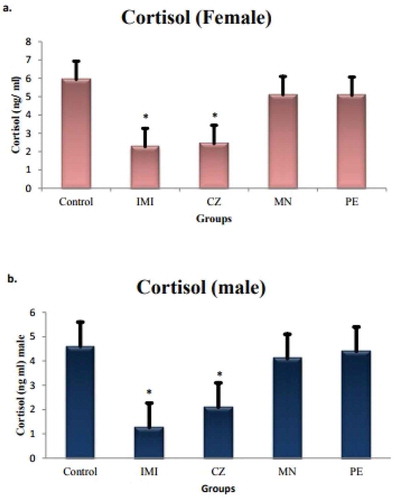
Figure 2. 2% agarose gene expression images of GR—glucocorticoid receptor in kidney, thyroid, ovary gills, brain and liver. C—control, CZ—curzate, IMI—imidacloprid, MN—micronutrient mixture, PE—pyzosulphuron ethyl.
Figure 3. Graph showing relative expression pattern of the glucocorticoid receptor (GR) in four different groups of O. mossambicus exposed to agrochemicals.
Note: (*) Denotes the significance of *p < 0.05.
Figure 4. Illustrates the interaction of various genes with glucocorticoid receptor (NR3C1) using pathway commons and Cytoscape software.
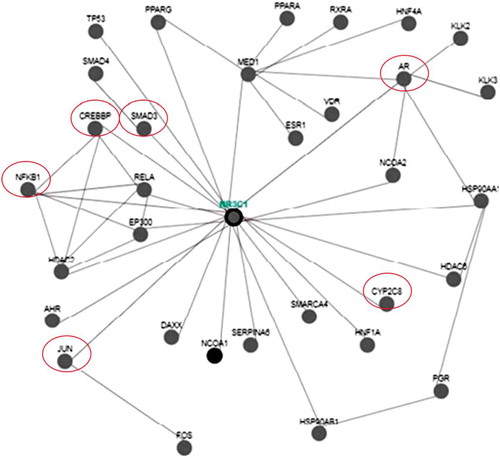
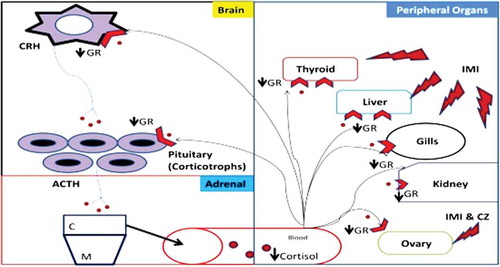
Figure 5. Conclusion—schematic representation of hypothalamus–pituitary interrenal axis (HPI) under the exposure of agrochemicals (PE—pyzosulphuroethyl, IMI—imidacloprid, MN—micronutrient mixture and CZ—curzate). CRH—cortocotropin releasing hormone, ACTH—adrenocorticotropic hormone, GR—glucocorticoid receptor, C—cortical region, M—medullary region.