Figures & data
Table 1. Selected Myanmar medicinal plants
Table 2. % Inhibition of various biological activities and total phenolic content of selected Myanmar medicinal plant extracts
Figure 1. Standard calibration curve of gallic acid at concentrations of 0, 1.7, 5, 15, 44, 131, 392 and 1,176 mg/L.
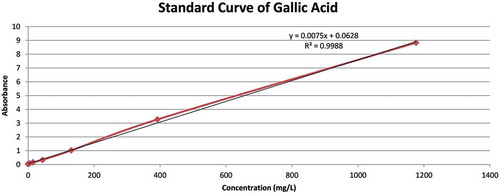
Figure 2. Correlation between TPC and inhibition rate (%) of DPPH, NO, SO and AGE of selected Myanmar medicinal plant extracts. TPC: total phenolic content; DPPH: 2,2-diphenyl-1-picrylhydrazyl; NO: nitric oxide; SO: superoxide; AGE: advanced glycation end-product.
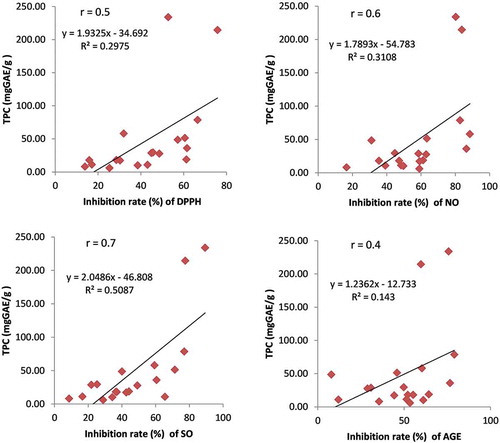
Table 3. Antimicrobial activity of selected Myanmar medicinal plant extracts