Figures & data
Table 1. Sampling schedules
Table 2. Measured concentration of chlorpyrifos in dilutionsa
Figure 1. Population dynamics of neonates in chlorpyrifos exposures.
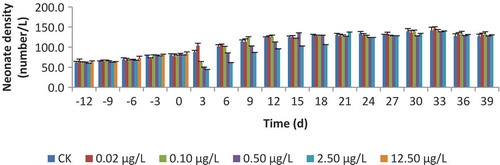
Figure 2. Population dynamics of adults in chlorpyrifos exposures.
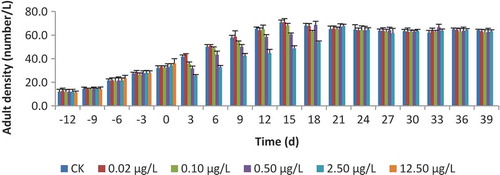
Figure 3. Inherent activity of ChE in adults in different exposure of chlorpyrifos.
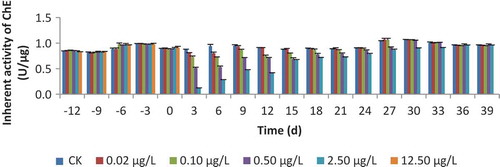
Figure 4. Apparent activity of ChE in adults in different exposure of chlorpyrifos.
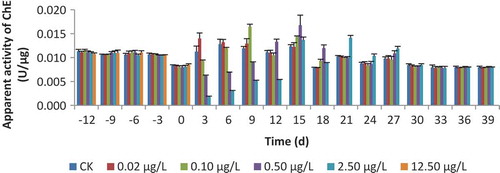
Figure 5. Immuno-reactive content of NAGase in media.
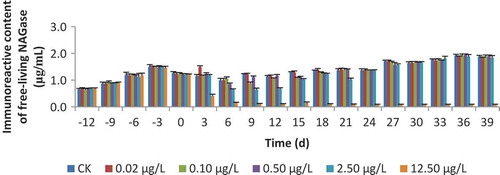
Table 3. Result of multiple comparisons for each of the test indexesa
Table 4. Points of departure of chlorpyrifos for each of the test indexes
Table 5. Some points of departure of chlorpyrifos reported by other researchers
Table 6. Regressive equations established between population and ChE (3 to 21 d after dose administration)
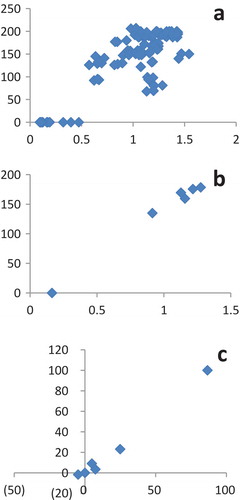
Figure 6. Status of population and that of ChE 3 to 21 d after dose administration.
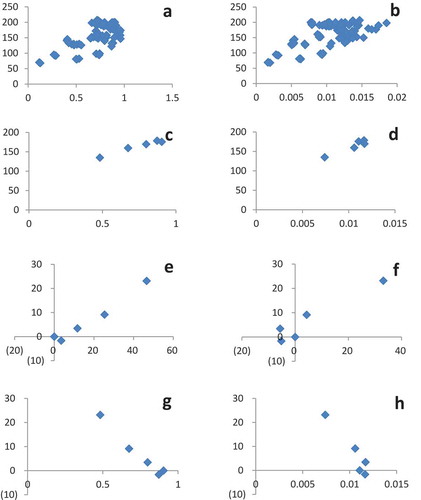
Table 7. Regressive equations established between population and NAGase (3 to 21 d after dose administration)
Figure 7. Status of population and that of NAGase 3–21 d after dose administration.