
Figures & data
Table 1. A comparison of the demographic status of the patients between two groups
Table 2. The causes of infertility between two groups
Figure 1. A comparison of oocyte count and embryo transfer rate between calcium and placebo groups.
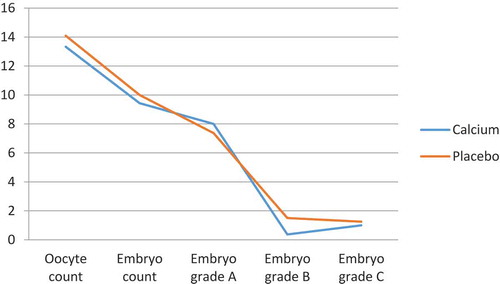
Figure 2. A comparison of clinical pregnancy between calcium and placebo groups.
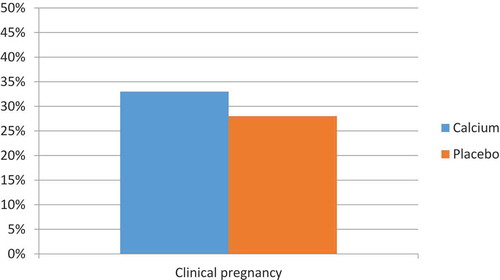
Table 3. A comparison of the oocyte count and embryo grading and clinical pregnancy between calcium and placebo groups
Table 4. A comparison of clinical pregnancy and embryo transfer rate between calcium and placebo groups
Table 5. A comparison some symptoms of OHSS and Prevalence of mild, moderate and sever OHSS between two groups
Figure 3. A comparison some symptoms of OHSS and Prevalence of mild, moderate and sever OHSS between two groups.
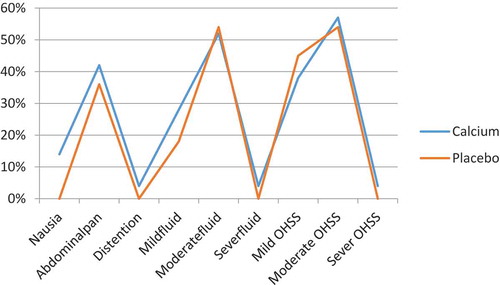
Table 6. A comparison between mean of blood WBC and Hb and HCT between two groups