Figures & data
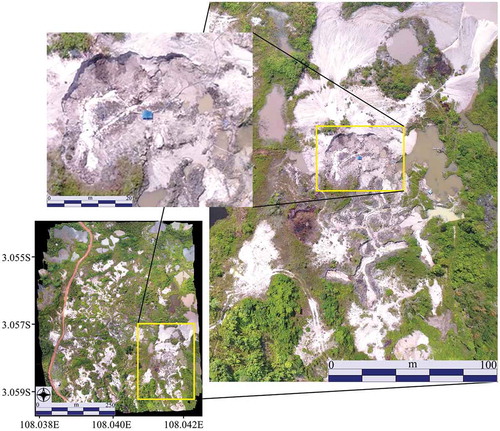
Figure 1. Overview of Belitung Island and the selected sites for implementing the aerial survey with the drone. In the eastern part of the island, mining activities are evident. The dark features are small lakes generated by the mining process (zoomed image). The dotted area within the image represents the survey area for the flight zones. The selected sites are hereafter referred to as Sites 1 and 2. Images are sourced from Google Earth.
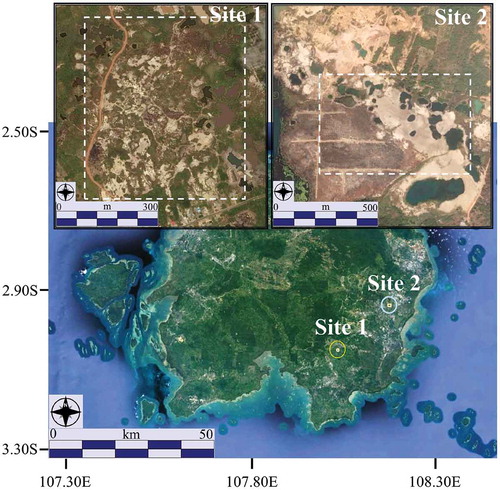
Figure 2. Flight paths of the Phantom 4 drone across (a) Site 1 and (b) Site 2. Site 1 was flown using manual flight control and Site 2 was flown using an automated flight plan.
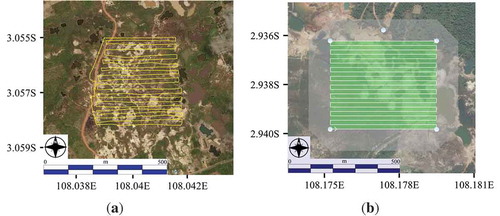
Table 1. Sensitivity of the MLP model to forcing a single independent variable to be constant. Skill measure represents the measured accuracy minus the accuracy expected by chance. If skill measure shows higher decrease from the accuracy, the variable is considered to have higher influence to the model
Figure 3. Land-use/land-cover map of Belitung Island based on PALSAR-2 data.
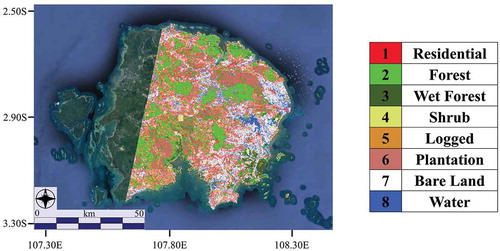
Figure 4. Orthophoto of the two sites generated by using Photoscan Pro, with 655 photos for Site 1 and 517 photos for Site 2. (a) A screen capture of generating the point cloud from the photos at Site 1; the blue marks are the estimated camera positions and the black perpendicular line is the axis. (b) The data for Site 2. (c) The final orthophoto generated for Site 1 and (d) for Site 2.
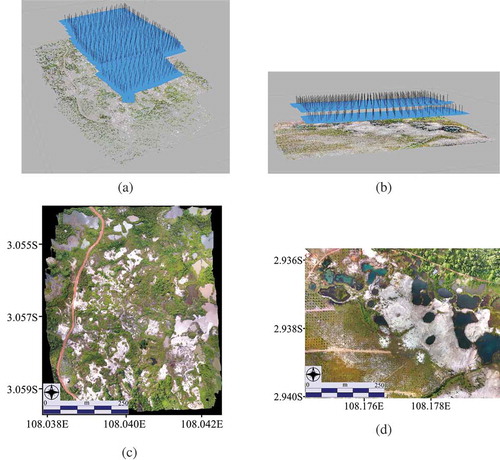
Figure 5. Topographical information for Site 1 and Site 2. (a) and (b) are the DSMs showing the elevation heights from the ellipsoid for Site 1 and Site 2, and (c) and (d) are the slope maps of Site 1 and Site 2, respectively.
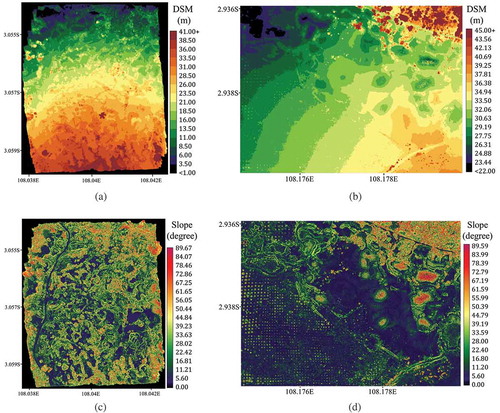
Figure 6. Top images show the LULC maps generated from the drone imagery for (a) Site 1 and (b) Site 2. Bottom images indicate the subset area (enlarged area) of the candidate sites for the LULC maps based on the SAR imagery for (c) Site 1 and (d) Site 2.
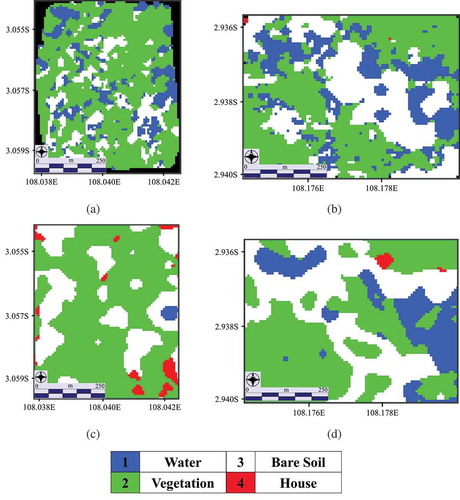
Figure 7. Local worker using water pumps for tin mining. They are usually difficult to recognize in situ because they tend to stay away from the main roads. Massive terrain degradation from the activity can be clearly observed using the drone images, which is difficult to detect from the SAR image (at Site 1).