Figures & data
Figure 1. The location map of the study area in conjunction with PSRWT tunnel project with adjacent reservoirs and rivers.
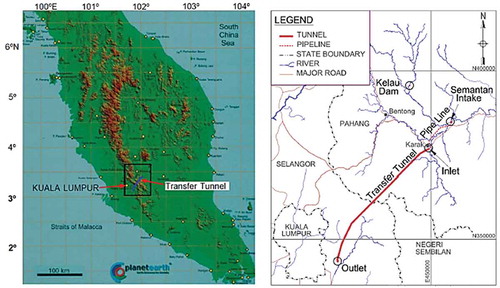
Figure 2. The cross-section of PSRWT tunnel project from Karak to Langat crossing the Titiwangsa Main Range Granite body (After KeTTHA, Citation2000).
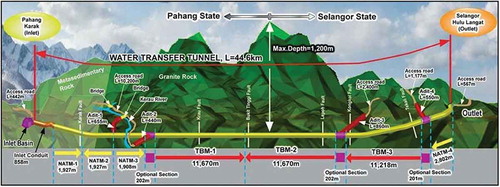
Figure 3. Heavy water flow, at right crown and wall of an average rate of 3.5 ton per minute. (Location: TD 3376.6, TBM-1, Karak).
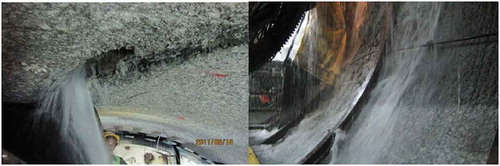
Figure 4. (a) Existing pipeline damaged due to water hammer with installation of additional pump (55 kW x 2, 110 kW x 1) at chamber; (b) Water inflow at TBM back up trailer (Max. 1.3 m high at TBM).
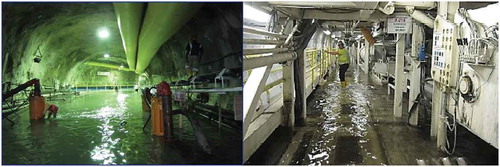
Figure 5. The geological map of the study area. (Modified after Maps of Kuala Kubu Baharu (Sheet 86), Selangor (Sheet 94) and Kuala Kelawang (Sheet 95)).
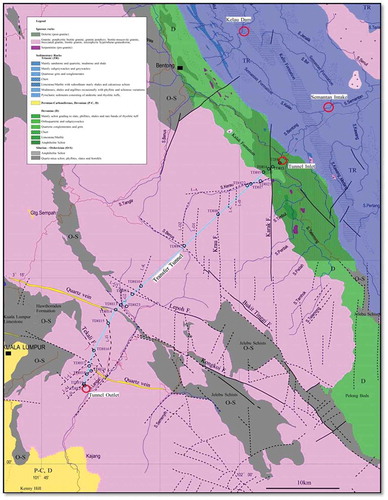
Table 1. Summary of geological map from TD 2000 m until 4000 m
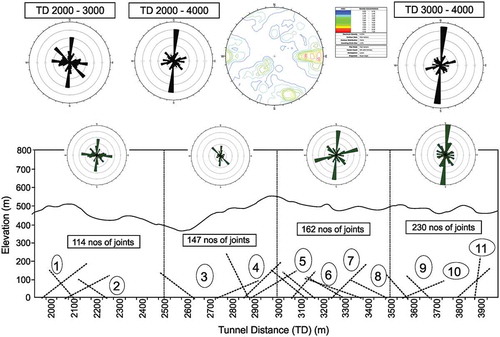
Figure 6. Non-scale schematic diagram of fault zone with lineament line, location of joints sets and local water inflow through of the study area.
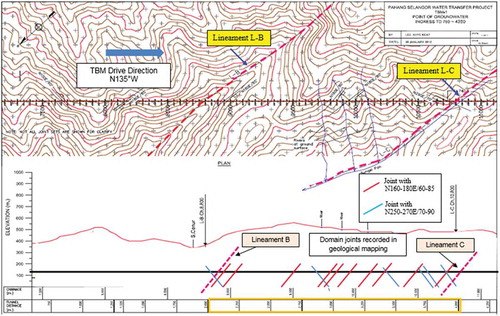
Figure 7. Stereographical projection and rosette diagram, an equal area lower hemisphere plot of great circles representing the average dip and dip directions of two discontinuity sets in a rockmass.