
Figures & data
Figure 1. Appearance of the right wrist in the first visit to our outpatient clinic.
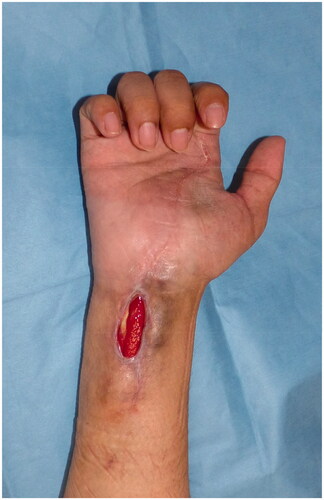
Figure 2. Contrast-enhanced MRI showing hypertrophy of the synovial sheath on the flexor tendon (arrows) with T2 fat suppression.
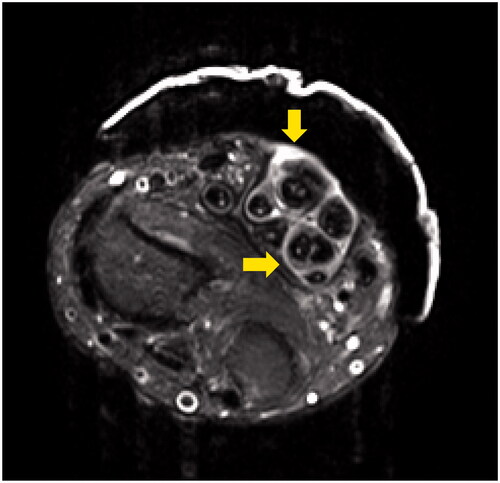
Figure 3. Intraoperative photograph. The wound was filled with an inflamed synovial sheath (A). A temporoparietal fascia flap was harvested from the right temporal region. A skin paddle (arrow) was made from the anterior part of the right ear (B). The median nerve was wrapped in the flap and then placed between FDS and FDP (C). A full-thickness skin graft was harvested and grafted onto the flap. Arrow indicate anastomosis sight (D).
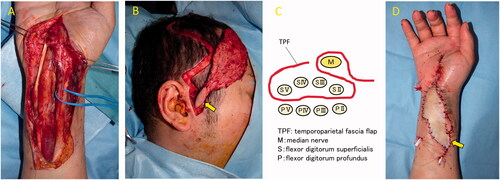
Figure 4. The pathological finding of the synovial sheath with HE staining showed epithelioid cell granuloma (A). However, there were no mycobacteria with Thiel-Nielsen staining (B).
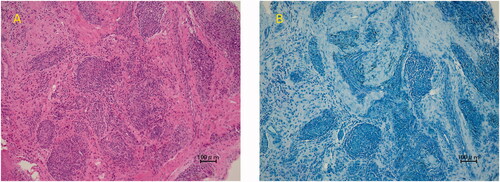
Figure 5. Appearance of the right wrist 1 year and 10 months after surgery.
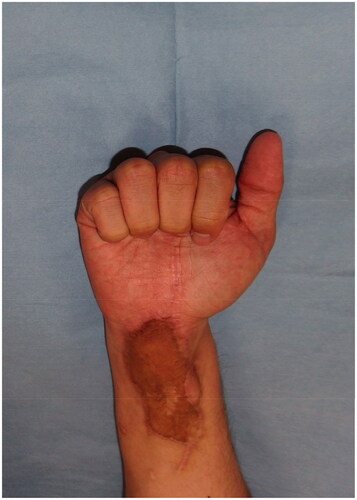
Table 1. Preoperative ROM.
TABLE 2. Postoperative ROM.