Figures & data
Figure 1. Smoothed house prices.
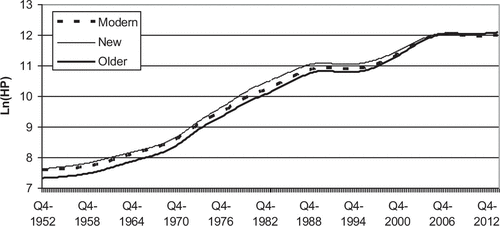
Figure 2. New-Modern coherence and cospectrum against fractions of π radians.
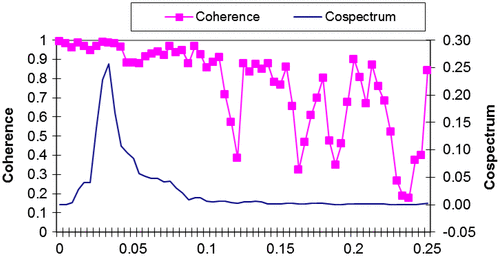
Figure 3. New–Older coherence and cospectrum.
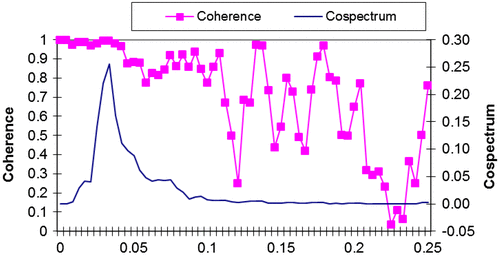
Figure 4. Modern–Older coherence and cospectrum.
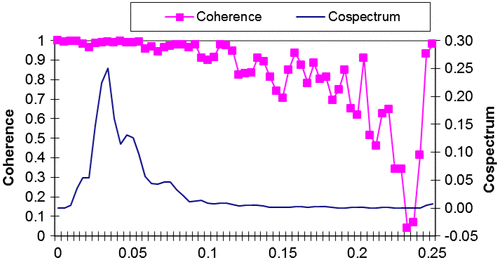
Figure 5. Older power spectrum.
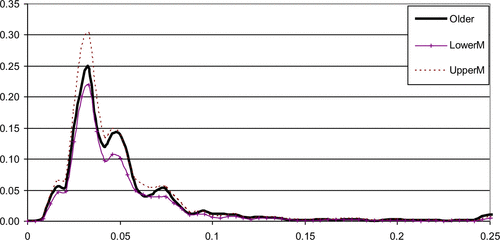
Figure 6. Modern power spectrum.
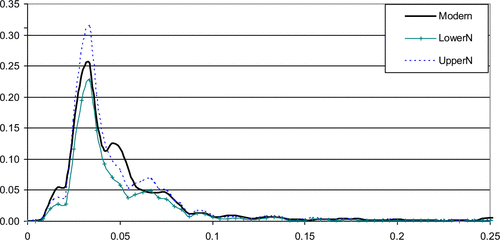
Figure 7. Older power spectrum.
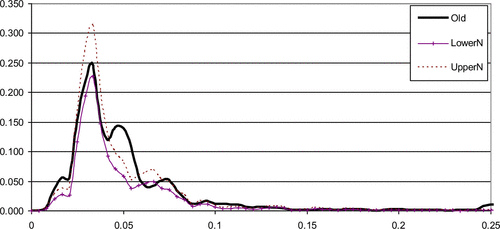
Figure 8. Expenditure-New power spectra and cospectrum.
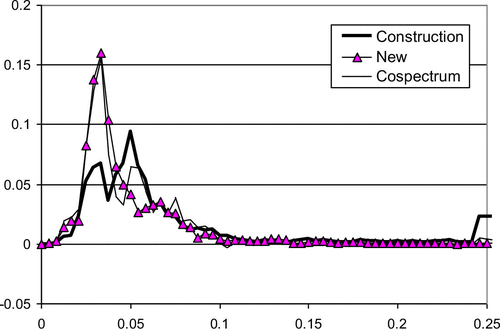
Figure 9. Construction with New prices.
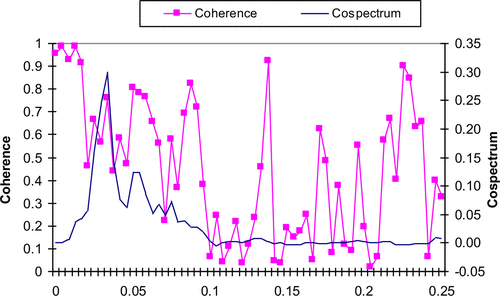
Figure 10. Construction with Modern prices.
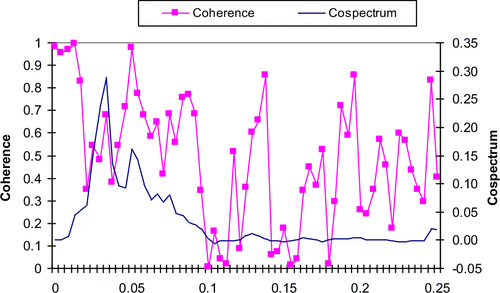
Figure 11. Construction with Older prices.
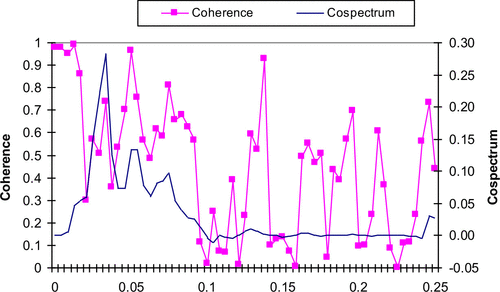
Figure 12a. Loan to income and value ratios FTB.
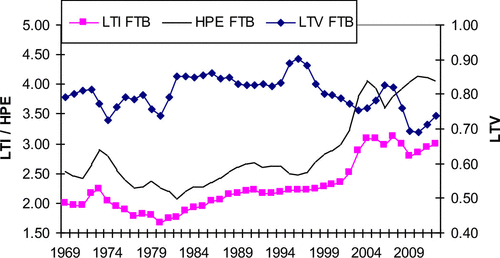
Figure 12b. Loan to income and value ratios RB.
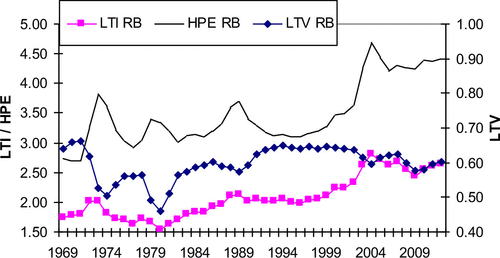
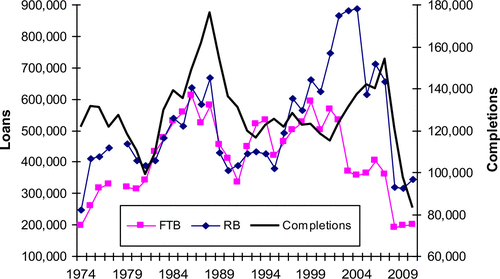
Figure 13. Completions and numbers of buyers with mortgages in the market.