Figures & data
Table 1. Cereal yield in Nigeria, neighbouring Niger and rest of Africa, 2000–2010
Figure 1. Grain market chain in the borderland.
Source: Adapted from Gerken et al. (Citation2009) and Author.
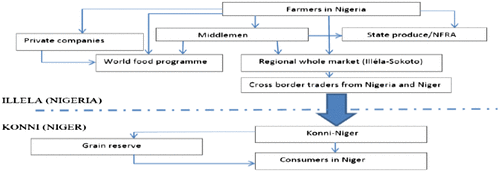
Table 2. Distribution of farmers by input use, storage methods and causes of storage loses in Illéla border land, Sokoto state
Figure 2. Open air grain trade activity in Illéla regional market, Sokoto state, Nigeria.
Source: Author.
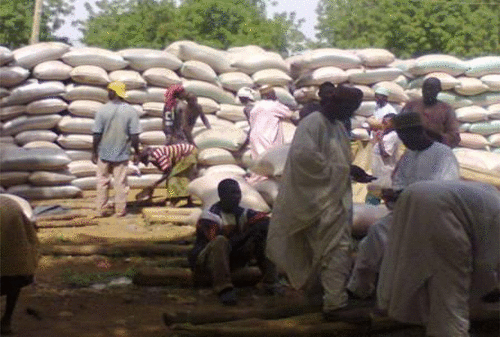
Table 3. Percentage distribution of traders by their characteristics
Table 4. Number of pick-up lorries crossing the border over four market operations between June and July 2012
Table 5. Estimate of grain traded over the period
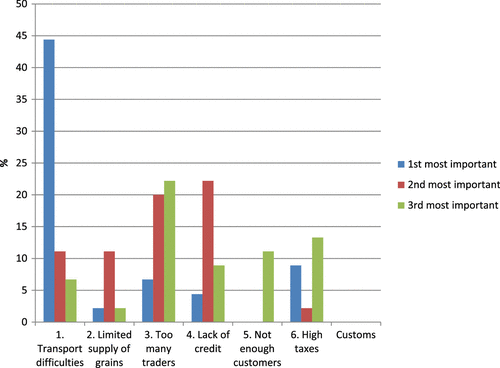
Figure 3. Risk factors as perceived by traders.
Note: Field survey 2012. Source: Author.