2,464
Views
5
CrossRef citations to date
0
Altmetric
Research Article

The value premium within and across GICS industry sectors in a pre-financial collapse sample

ORCID Icon | (Reviewing Editor)
Article: 1045214 | Received 26 Jan 2015, Accepted 27 Mar 2015, Published online: 20 May 2015

Figures & data

Table 1. Industry group BE/ME characteristics ordered by median BE/ME. June 1999 to May 2007, (n = 96)

Table 2. Annual ranking of GICS industry BE/ME characteristics. June 1999 to May 2007, (n = 96)

Table 3. Equal-weighted excess monthly returns of GICS sorted industry groups regressed on the Fama–French three-factor model. June 1999 to May 2007, (n = 96)

Rpt-Rft=a+b[Rmt-Rft]+sSMBt+hHMLt+et

Figure 1. Average annual percentage of GICS industry group stocks appearing in various BE/ME quintiles, June 1999 to May 2007 (n = 96).
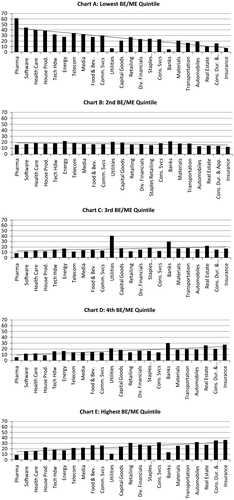
Figure 1. Average annual percentage of GICS industry group stocks appearing in various BE/ME quintiles, June 1999 to May 2007 (n = 96).

Table 4. Average portfolio returns for stocks sorted by GICS industry sector and then 2 × 5 on size and BE/ME. June 1999 to May 2007, (n = 96)

Table 5. Average January returns and average monthly returns excluding January for sector portfolios sorted 2 × 5 for size and BE/ME. June 1999 to May 2007

Table 6. Average monthly GICS industry sector portfolio returns for stocks sorted 2 × 5 on size and BE/ME, excluding returns for the month of January. June 1999 to May 2007, (n = 88)