Figures & data
Figure 1. Size of the unit root tests of models 1 and 2 for 500 observations with white noise errors: (a) Model 1 and (b) Model 2.
Notes: Solid line is unit root test with NoVaS critical values; dot–dash line is unit root test with DF critical values.
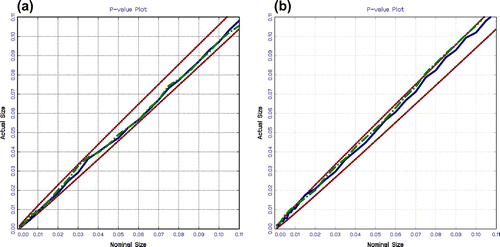
Figure 2. Power of the unit root tests of Model 1 for 500 observations with white noise: (a) Model 1 and (b) Model 2.
Notes: Solid line is unit root test with NoVaS critical values; dot–dash line is unit root test with DF critical values.
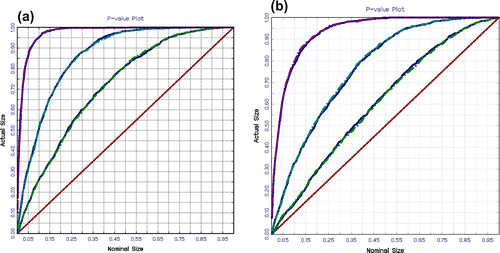
Figure 3 Size of the unit root tests for 500, 1,000 and 2,000 observations with GARCH errors: (a) Model 1 and (b) Model 2.
Notes: Solid line is unit root test with NoVaS critical values; dotted, dot–dash, and dashed lines are unit root tests with DF critical values for 500, 1,000, and 2,000 observations, respectively.
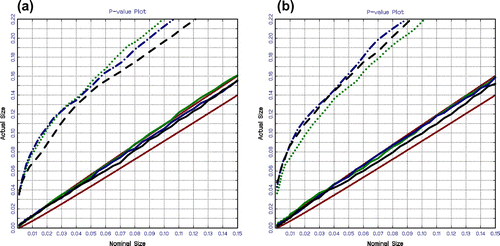
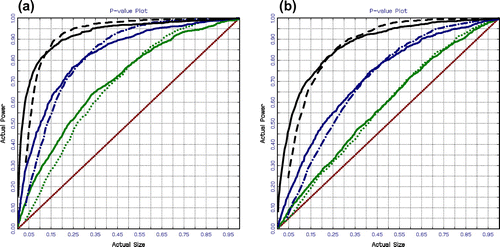
Figure 4. Power of the unit root tests for 500, 1,000, and 2,000 observations with GARCH errors: (a) Model 1 and (b) Model 2.
Note: Solid line is unit root test with NoVaS critical values; dotted, dot–dash, and dashed lines are unit root tests with DF critical values for 500, 1,000 and 2,000 observations, respectively.
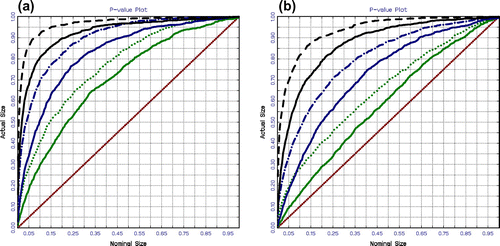
Figure 5. Size-adjusted power of the unit root tests for 500, 1,000, and 2,000 observations with GARCH errors: (a) Model 1 and (b) Model 2.
Notes: Solid line is unit root test with NoVaS critical values; dotted, dot–dash, and dashed lines are unit root tests with DF critical values for 500, 1,000, and 2,000 observations, respectively.