Figures & data
Figure 1. Wheat production in China from 1980 to 2015.
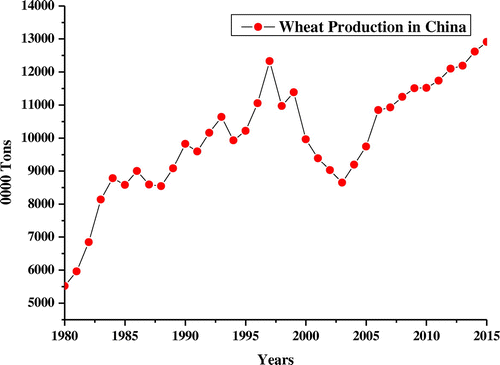
Figure 2. Rice production in China from 1980 to 2015.
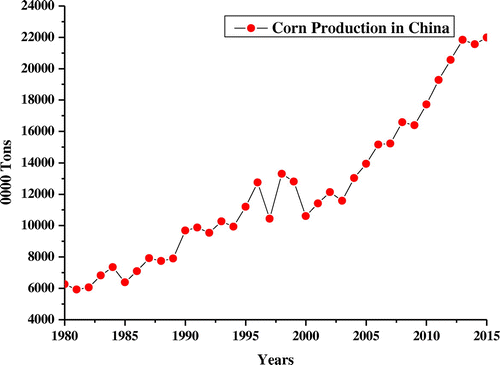
Figure 3. Cotton production in China from 1980 to 2015.
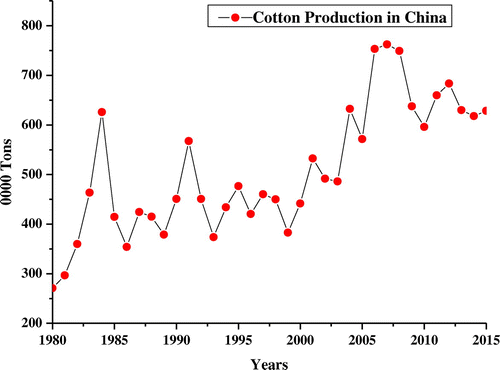
Figure 4. Sugarcane production in China from 1980 to 2015.
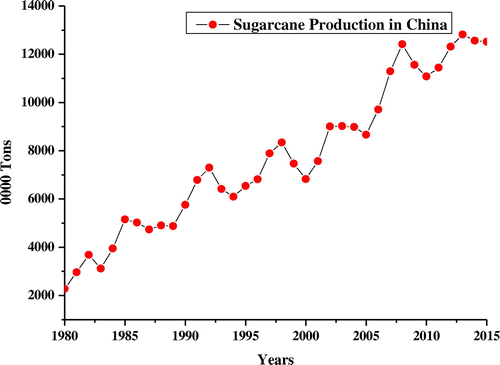
Figure 5. Corn production in China from 1980 to 2015.
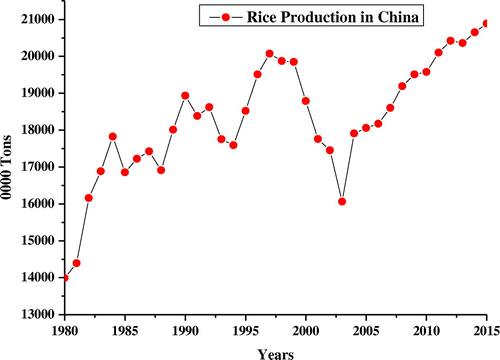
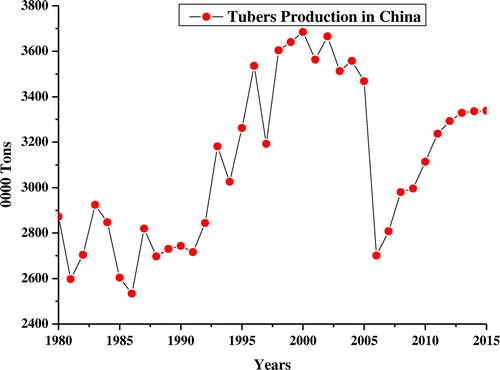
Figure 6. Tuber production in China from 1980 to 2015.