Figures & data
Table 1. Descriptive statistics for P(LTM)t and P(STM)t
Figure 1. Time plots of P(LTM)t, lnP(LTM)t, r(LTM)t.
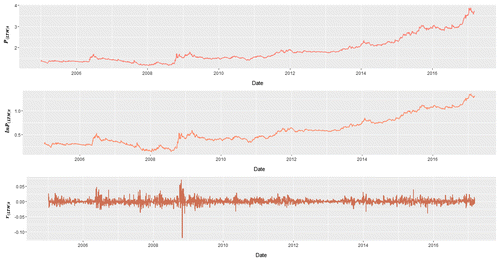
Figure 2. Time plots of P(STM)t, lnP(STM)t, r(STM)t.
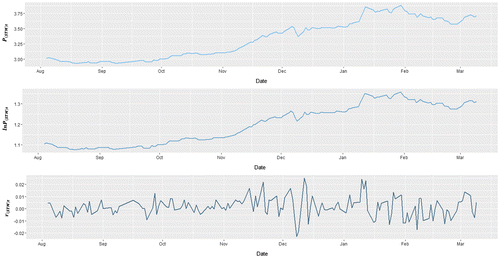
Table 2. ADF test for LTM and STM series
Table 3. Absolute means for LTMs
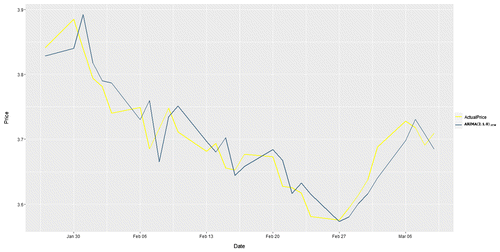
Figure 3. ARIMA (0,1,1)LTM predictions vs. actual price.
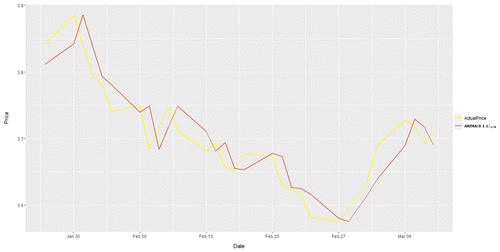
Table 4. Absolute means for STMs
Figure 4. ARIMA (2,1,0)STM predictions vs. actual price.