Figures & data
Table 1. ELR ratio for for different
-days
Figure 1. ELR ratio in the Gaussian random walk as per Spitzer’s identity.
Table 2. LM statistic and the ELR ratio in the MA (1) model as a function of fixed parameter and N with m =
simulations
Figure 2. LM statistic and ELR ratio in the MA (1) model for different values of N and fixed parameter .
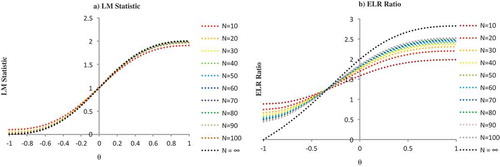
Table 3. LM statistic and the ELR ratio in the MA (1) model as functions of stochastic parameter and
with
simulations
Figure 3. LM statistic and ELR ratio in the MA (1) model for different values of and stochastic parameter
.
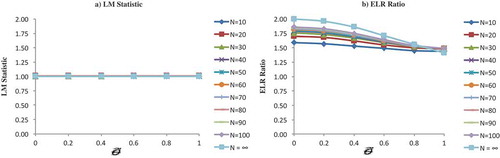
Figure 4. Deviation of LM statistic and the ELR ratio from their respective bootmean in the MA (1) model as a function of fixed/stochastic parameter for different values of N, i.e., for N = 10, N = 100 and ∞.
Table 4. Deviation of LM statistic and the ELR ratio from their respective bootmean in the MA (1) model as a function of fixed/stochastic parameter for different values of N
Table 5. Descriptive statistics of the 22 individual BSE SENSEX stocks
Table 6. Empirical analysis of LM statistic and ELR ratio on cross-sectional average of BSE SENSEX using bootstrap method in the overall sample period (January 2001 to September 2015)
Table 7. Empirical analysis of LM statistic and ELR ratio on cross-sectional average of BSE SENSEX using bootstrap method in the pre-crisis sample period
Table 8. Empirical analysis of LM statistic and ELR ratio on cross-sectional average of BSE SENSEX using bootstrap method in the post-crisis sample period
Table 9. Scatterplot of the deviation of CS average of LM statistic and ELR ratio from its bootmean in the pre-crisis period and post-crisis period for k-day = 10 and k-day = 20 {fig a, fig b, fig c, fig d}. Scatterplot of the deviation of actual ELR and actual theta from the CS average of BSE SENSEX in the pre-crisis and post-crisis period {fig e, fig f}.
Figure 5. LM statistic and ELR ratio on cross-sectional (CS) average of BSE SENSEX with confidence interval in the overall sample period (January 2001 to September 2015).
Figure 6. Scatterplot of LM atatistic and ELR ratio from its bootmean for k-day = 10 and k-day = 20 in the combined sample.
Figure 7. Scatterplot of ELR ratio and for k-day = 10 and k-day = 20 in the combined sample.
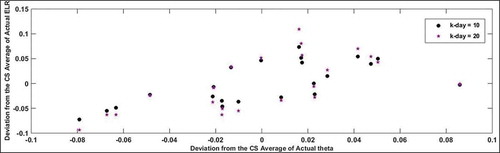
Figure 8. LM statistic and ELR ratio on CS average of BSE SENSEX with confidence interval in the pre-crisis period (January 2001 to December 2007).
Figure 9. LM statistic and ELR ratio on CS average of BSE SENSEX with confidence interval in the post-crisis period (January 2008 to September 2015).