Figures & data
Figure 1. Production and exports rank of Pakistani rice compared to other countries.
Source: Authors’ calculation based on FAO, 2017
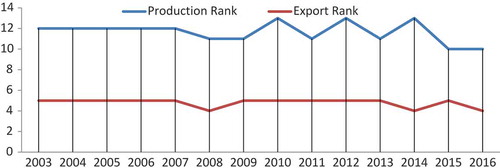
Table 1. Description of variables
Figure 2. Percentage contribution in overall world’s rice exports (in terms of Dollar value).
Source: Authors’ compilation based on UN Comtrade and FAO.
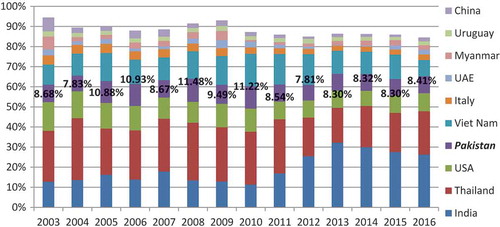
Figure 3. Competitiveness indicators (RCA) of Pakistan compared with major rice exporters.
Source: Authors’ calculation
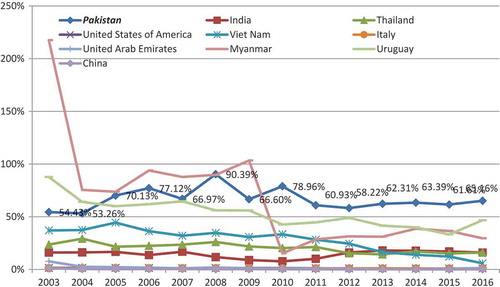
Figure 4. Competitiveness indicators (RCA#) of Pakistan compared with Major rice exporters.
Source: Authors’ calculation.
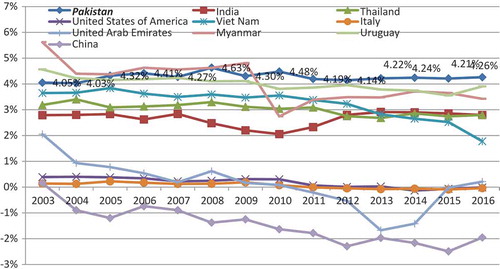
Table 2. Results of Pesran’s (Citation2004) CD test
Table 3. Gravity results with PPML and time-fixed effects, (2003–2016)
Table 4. Rice export potentials of Pakistan
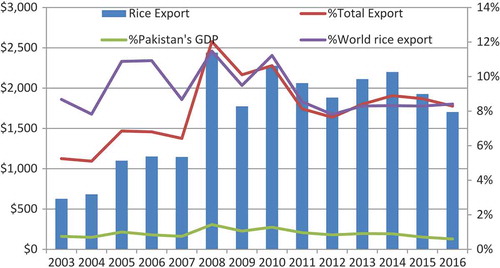
Figure A. Represents Pakistan’s rice exports and percentage share with total exports, GDP and world rice export.
Source: Authors’ compilation based on data UN COMTRADE and FAO, 2018.