Figures & data
Figure 1. Oil price between 1990Q1 and 2017Q2.
Figure shows crude oil price in US dollars per barrel. The data comes from Datastream hit WDQ76AAZA.
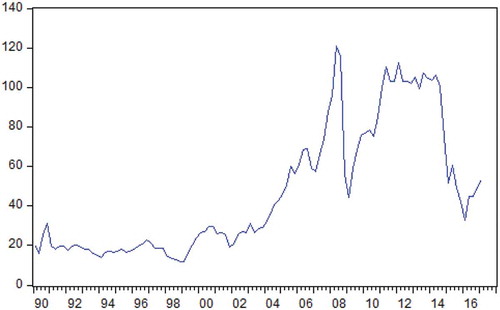
Figure 2. Government expenditure on education as % of total government expenditure 1990Q1–2017Q2.
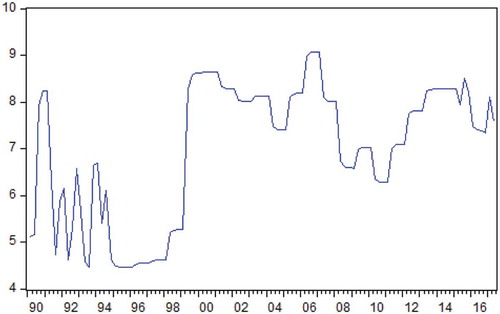
Figure 3. Government expenditure on health as % of total government expenditure 1990Q1–2017Q2.
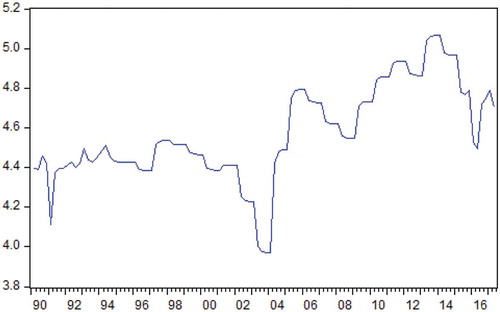
Table 1. Descriptive statistics
Table 2. Augmented Dickey-Fuller unit root tests
Table 3. ARDL estimated coefficients
Figure 4. Cumulative sum of recursive residuals.
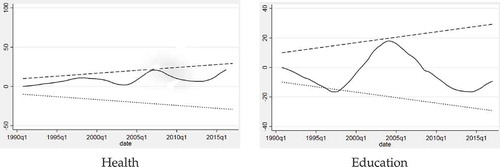
Table 4. Dynamic asymmetric estimation of oil prices on government expenditures on Education and Health
Table 5. NARDL estimation with only the long-run asymmetries
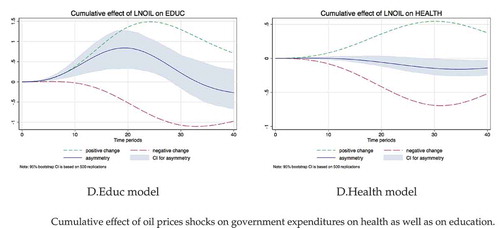
Figure 5. Cumulative dynamic multiplier.