
Figures & data
Table 1. Summary of regional IC and tangible investments per labor, export and profit shares of value added in private sector in Finland 2000–2013
Table 2. Regression on the persistence of RSCA export indices
Table 3. Growth accounting of GDP growth in production and market services
Table 4. Determinants of the regional growth of RSCA export and import indices, fixed-effect estimates
Table 5. Determinants of the regional growth of export and import shares, fixed-effect estimates
Figure A.1. Domestic value added in exports by domestic firms, foreign MNEs and foreign value added 2009 in 22 countries.
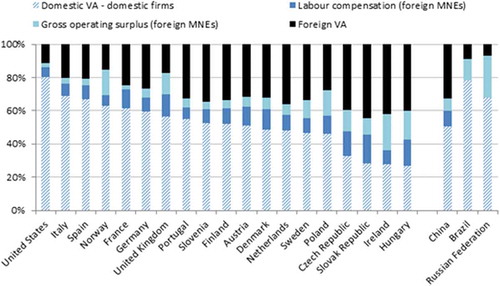
Figure A2. Firm types in gross exports and value added of exports in Nordic countries, 2013.
Source: Nadim (Citation2017)
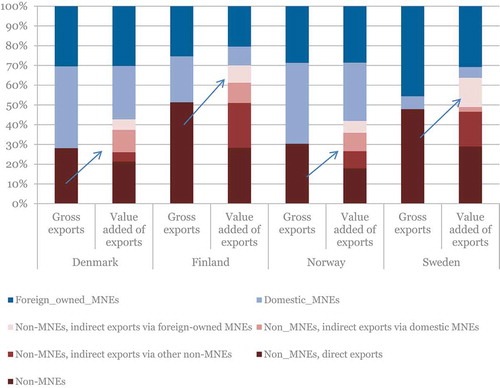
Table A.1. Summary tables of firm-level figures in Ostrobothnia, Etelä-Pohjanmaa and Uusimaa
Table A.2(a). Revealed comparative advantage RCA in Ostrobothnia region in 1999–2013 using the adjusted Balassa’s comparative advantage measure RCA
Table A.2(b). Revealed comparative advantage in Etelä-Pohjanmaa region in 1999–2013 using the adjusted Balassa’s comparative advantage measure RCA
Table A.2(c). Revealed comparative advantage in Uusimaa region in 1999–2013 using the adjusted Balassa’s comparative advantage measure RCA
