
Figures & data
Figure 1. International Migrant Stock, Male and Female, SSA, 1990–2017.
Source: Author’s based on UN data (2017).
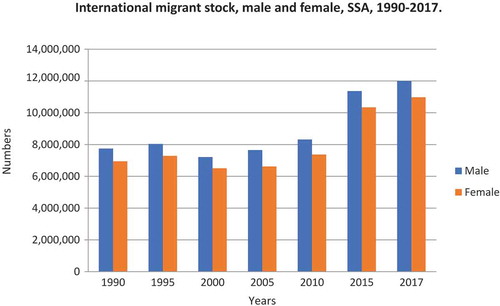
Figure 2. International migrant stock as a percentage of population, SSA.
Source: Author’s based on UN data (Citation2017).
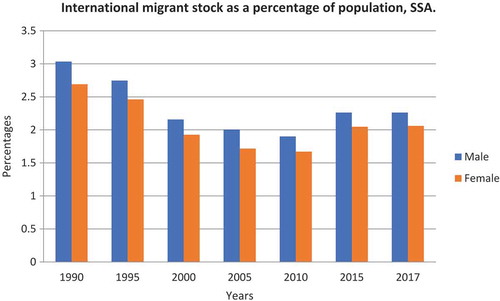
Figure 3. Percentage change (growth) in migrant stock & population, SSA, 1990–2015.
Source: Author’s based on UN data (Citation2017).
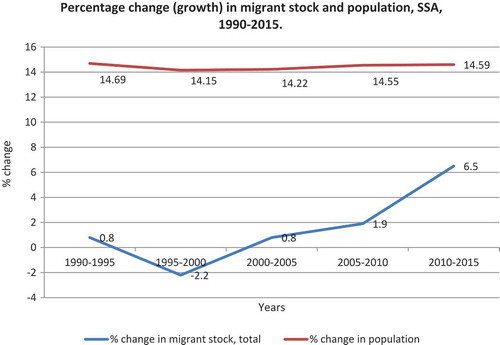
Table 1. Top 10 emigration countries in SSA and their top five destination countries for 2013, in descending order
Figure 4. International migrant Stock by age and sex, SSA, 2000.
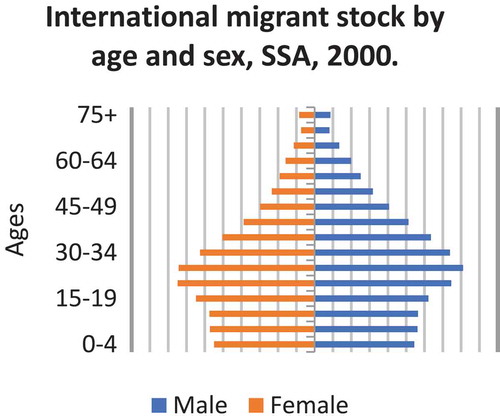
Figure 5. International migrant Stock by age and sex, SSA, 2010.
Source: Author’s based on UN data (2017).
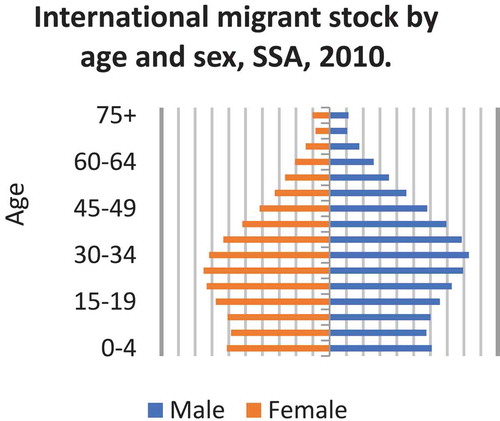
Figure 6. International migrant stock by age and sex, SSA, 2017.
Source: Author’s based on UN data (2017).
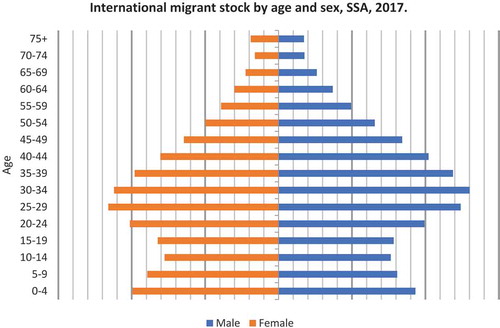
Figure 7. Emigration from SSA to identified destinations, 2005–2013.
Source: Author’s based on UN data (2017).
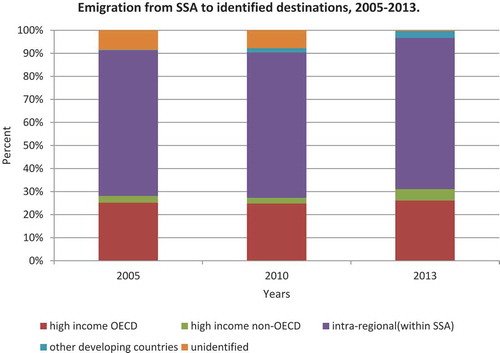
Figure 8. Remittances received in current US$, SSA.
Source: Author’s based on World Bank Data (Citation2017).
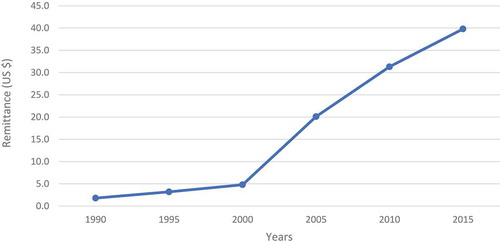
Figure 9. Remittances received as a percentage of GDP, SSA.
Source: Author’s based on World Bank Data (Citation2017).
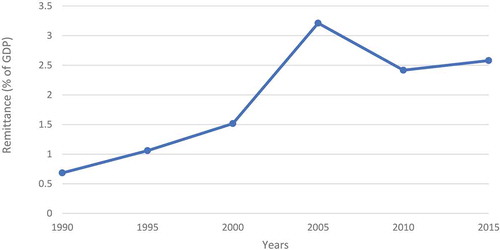
Figure 10. Sources of remittances to SSA, 2010.
Source: Ratha et al. (Citation2011, p. 53).
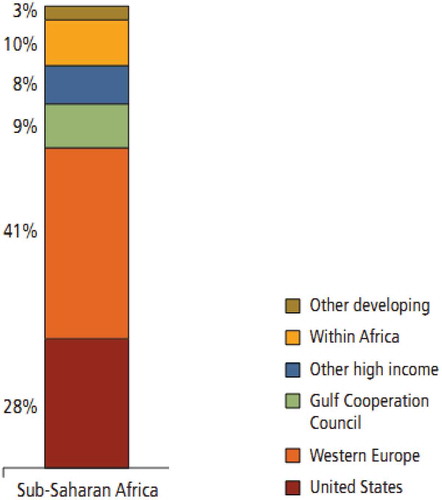
Figure 11. Remittances sent and received, various regions, 1990–2015 average.
Source: Author’s based on World Bank data (Citation2017).
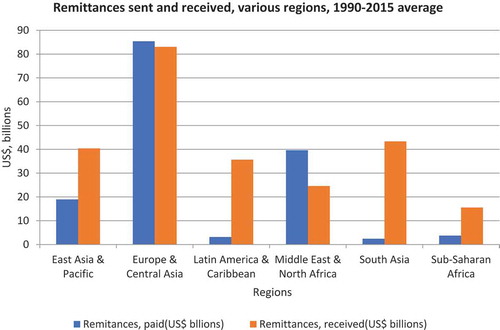
Figure 12. Growth of remittances received, various regions, 1990–2015.
Source: Author’s based on World Bank (Citation2018) data.
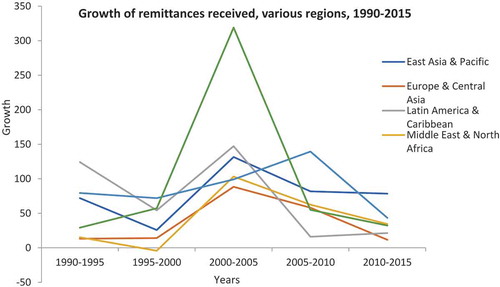
Figure 13. Remittances received in US$ for top 10 SSA countries, 2015.
Source: Author’s based on World Bank (Citation2017).
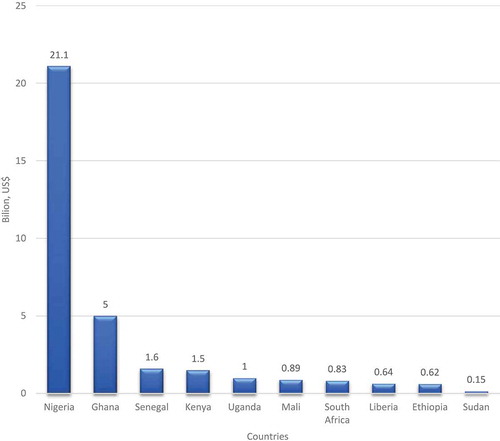
Figure 14. Remittances received as a percentage of GDP for top 10 SSA countries, 2015.
Source: Author’s based on World Bank (Citation2017).
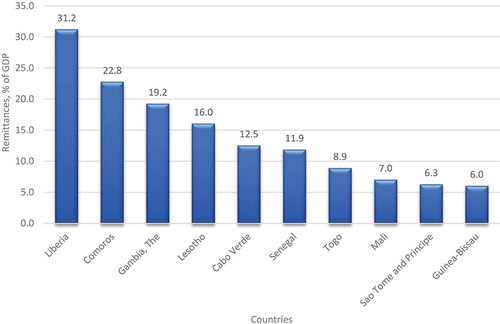
Figure 15. Remittances and other resource flow to SSA, 2000–2015.
Source: Author’s based on World Bank (Citation2017).
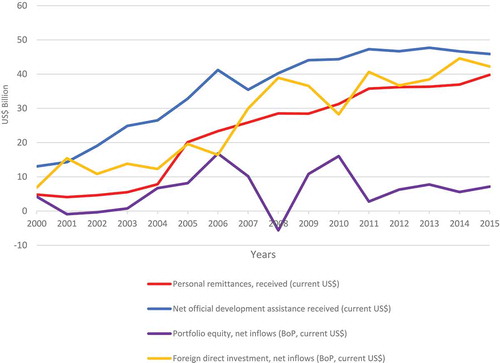
Table 2. Uses of remittances in some African countries, by the source of remittance (percentage of total remittance)
Figure 16. Educational outcomes for various regions, 1990–2015 average.
Source: Author’s based on World Bank (Citation2017).
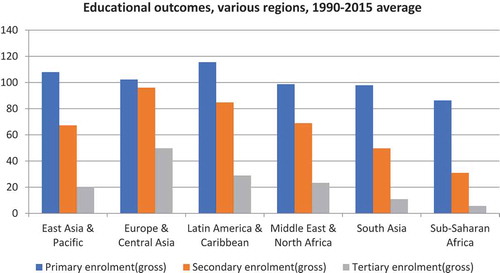
Figure 17. Health outcomes for various regions, 1990–2015 average.
Source: Author’s based on World Bank (Citation2017).
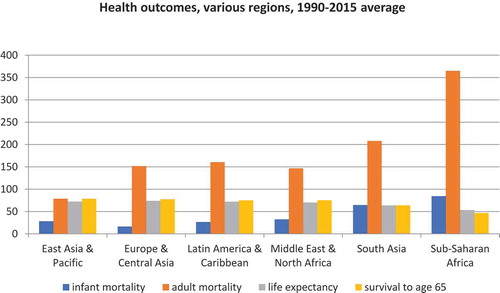
Table 3. Descriptive statistics
Table 4. Correlation matrixes between real remittance per capita, education and health outcomes
Table 5. Stationarity tests for various variables
Table 6. Real remittance per capita and education
Table 7. Real remittance per capita and health