
Figures & data
Figure 2. Comparison of performances between non-restructured banks and restructured banks (Step 1 and Step 3 DEA).
Note: CRS_TE: constant variable to scale of technical efficiency; VRS_TE: variable return to scale technical efficiency; SCALE: Scale efficiency.
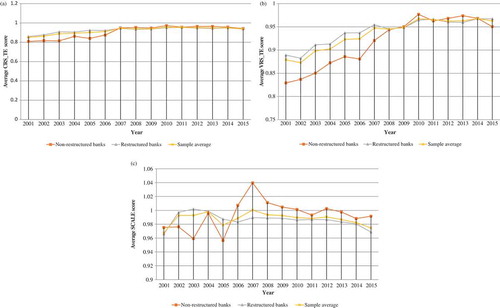
Table 1. The environment variables include six variables representing country-specific factors
Table 2. Summary statistic of dummy variables and environment variables
Table 3. Descriptive statistics of step 1 and step 3 DEA’s variables
Table 4. SFA regression step 2
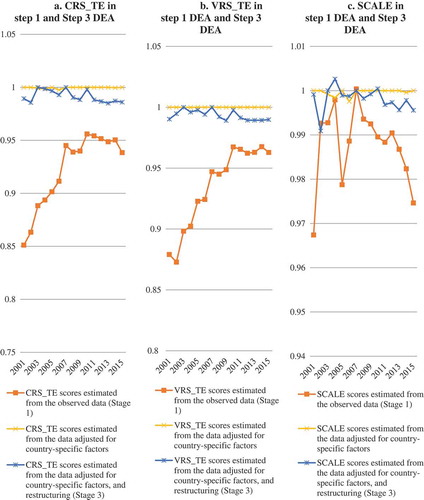
Figure 1. Bank efficiency in DEA step 1 and step 3.
Note: CRS_TE: constant variable to scale of technical efficiency; VRS_TE: variable return to scale technical efficiency; SCALE: Scale efficiency.
Appendix A. Restructuring measures of Vietnamese banks
