
Figures & data
Figure 1. The proportion of financial assets in South Africa in December 2016.
Source: SARB (Citation2016).
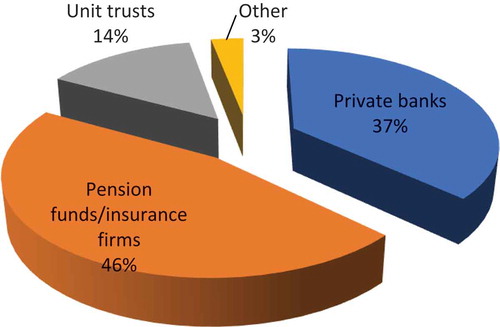
Figure 2. The market share of major banks in South Africa in December 2016.
Source: SARB (Citation2016).
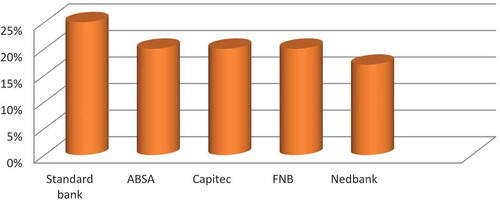
Figure 3. Lending and deposit rates in South Africa 1994Q1–2016Q4.
Source: SARB (Citation2016).
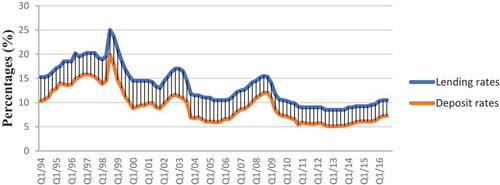
Table 1. The results of unit root tests
Table 2. ARDL cointegration test results
Figure 4. The CUSUM test.
Source: Author’s computation using E-views 10 Econometric Software.
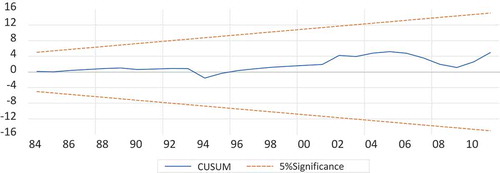
Figure 5. The CUSUM of Squares test.
Source: Author’s computation using E-views 10 Econometric Software.
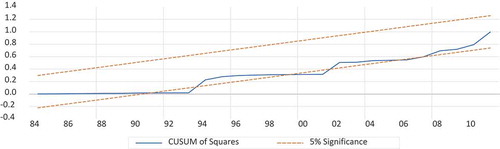
Table 3. Long- and short-run estimates of the ARDL method