
Figures & data
Table 1. Summary statistics
Table 2. Correlations
Table 3. Granger causality
Table 4. Sentiments indices versus Fama–French five factors—VAR model
Table 5. Sentiments indices versus Q-factors—VAR model
Figure 1. Impulse response function for the Fama and French (Citation2015) five-factors, Hou et al. (Citation2015) q-factors, VIX and GSVIs.
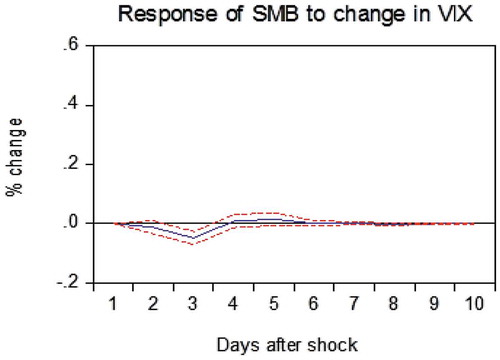
Table 6. Variance decomposition of Fama–French’s five factor, q-factors and D_VIX
Table 7. Variance Decomposition of Fama–French’s five factor, q-factors and Market Crash
Table 8. Variance decomposition of Fama–French’s five factor, q-factors and Bear Market
Table 9. Variance decomposition of Fama–French’s five factor, q-factors and Bull Market
Table 10. Variance Decomposition of Fama–French’s five factor, q-factors and Market Rally
Table A1. Monday effects in Fama and French’s RMW factor.
