
Figures & data
Table 1. Variables definition. This table presents the definitions of the variables used in the study
Table 2. Variables: descriptive statistics
Figure 1. Interdependencies among policy variables.
This figure presents the interrelationship diagram between dividend, leverage, and cost of capital along with the common variables influencing the three policy decisions and other key variables affecting a specific policy decision. DIV, LEV, and COC are the policy-related variables, which indicate the dividend payout ratio, debt ratio, and cost of capital, respectively. FAM, CORP, INS, ROA, RISK, and SIZE are common variables affecting the three policy decisions. FAM, CORP, and INS represent ownership proportion held by the family, corporate, institutional investors group, respectively. ROA, RISK, and SIZE specify profitability, operating risk, and firm size, respectively. CAPEX, R&D, and CR are specific to dividend decision, which denote investment, research and development expense ratio, and current ratio, respectively. Leverage specific variables are FATA, SGR, and MTB representing tangibility, growth in net sales (YoY), and market-to-book ratio, respectively. TAX, INT, DivGR, and DebtGR symbolize, tax ratio, interest ratio, dividend growth rate, and debt growth rate, respectively. These factors are specific to the cost of capital. Table explains each variable.
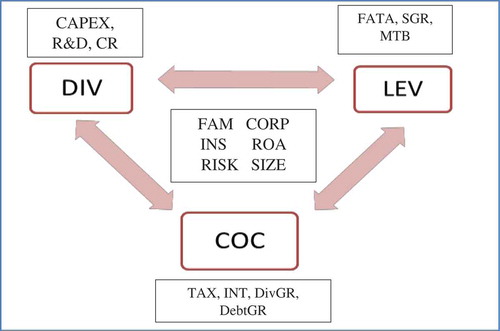
Figure 2. Cost of equity, debt, and capital (in %).
These graphs depict cost of equity (COE), cost of debt (COD), and cost of capital (COC), all in percentage, for aggregate sample firms, widely held firms, and family firms, respectively.
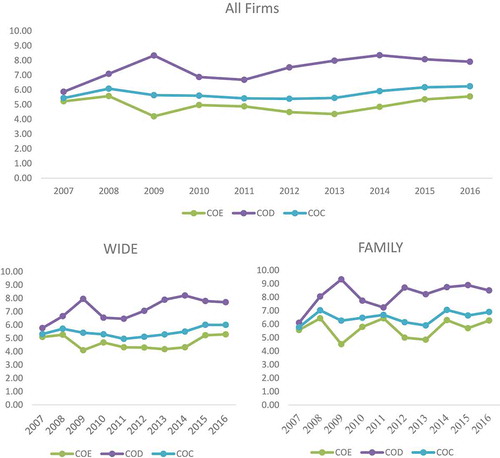
Table 3. DIV model
Table 4. LEV equation
Table 5. COC equation