Figures & data
Figure 1. Nigeria’s total government expenditure (1970–2017).
Trend of Nigeria’s central government expenditure where the horizontal axis shows six years in average. Computed from Statistical Bulletin of the CBN, Citation2017.
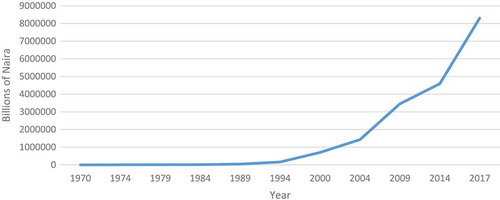
Figure 2. Share of total government expenditure in GDP (1970–2017).
Trend of Nigeria’s central government expenditure share to GDP where the horizontal axis shows two years in average. Computed from Statistical Bulletin of the CBN, Citation2017.
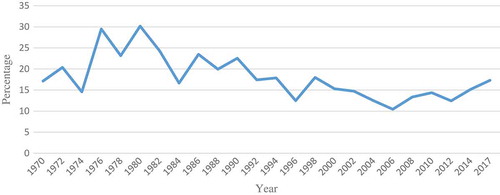
Table 1. Description of variables and sources of data
Table 2. Description of variables and sources of data
Table 3. ADF unit root test
Table 4. PP unit root test
Table 5. Result of bounds test for co-integration
Table 6. Estimated long-run coefficient using ARDL approach
Table 7. Estimated short-run error correction model using ARDL approach
Table 8. Diagnostic tests result
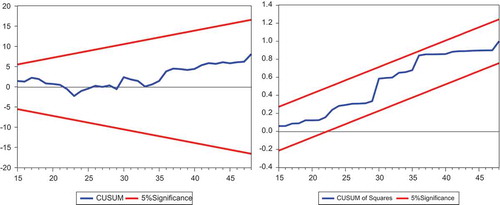
Figure 3. Model 1 CUSSUM and CUSSUM square stability tests.
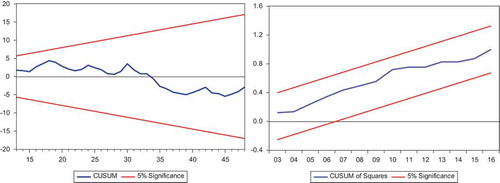
Figure 4. Model 2 CUSSUM and CUSSUM square stability tests.
Source: Computed by author using E-views 10.0.