Figures & data
Table 1. Data definitions
Figure 1. Industrial classification of sample firms.
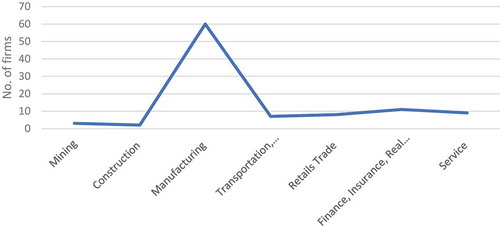
Figure 2. Sample companies’ CI reporting formats, 1999.
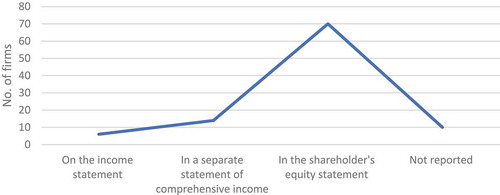
Figure 3. Presentation format and nature of OCI, 1999.
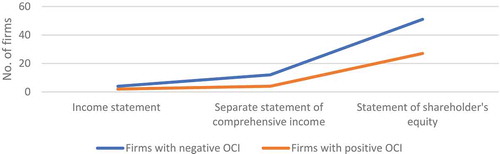
Table 2. Analysis of OCI components
Figure 4. Negative impact on EPS.
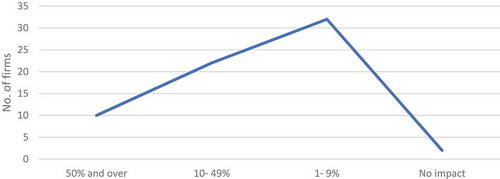
Figure 5. Positive impact on EPS.
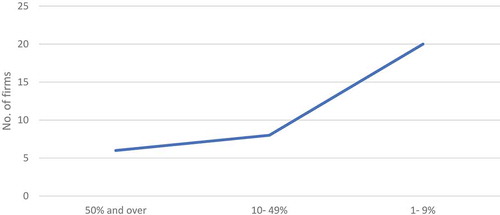
Table 3. Largest effects of Other Comprehensive Income (OCI)
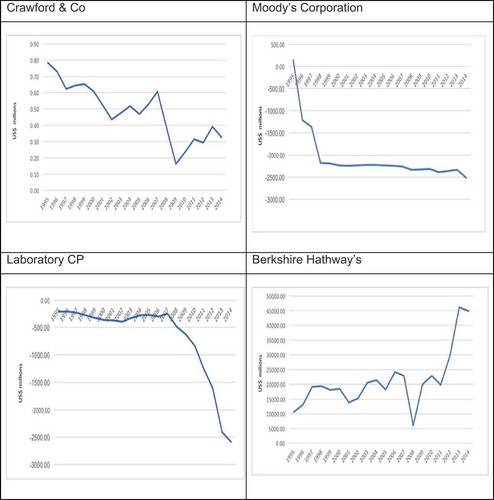
Figure 6. Accumulated other comprehensive income by individual companies.
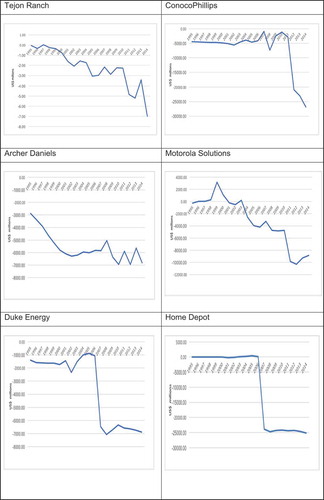
Figure 6. (Continued).