Figures & data
Table 1. Descriptive statistics for sample currency markets
Table 2. Test of stationarity of sample currency return series
Table 3. ADCC results for sample currency markets
Figure 1. Time-varying ADCC graphs of select emerging economies with BRIS (currency markets).
Notes: (i) The graphs in the figure show time-varying conditional correlations of only for those EMEs that have average ADCC values higher than/close to BRICS with rest of the BRICS markets, computed from the ADCC model. (ii) Graphs (a) to (d) show average ADCC values over the sample period of each EME with BRIS (reported only for those EME currencies that have average ADCC values higher than/close to BRIS, namely, CLP, COP, HUF, MXN, PLN, RON and TRY). Graphs (f) to (l) show average ADCC values of each of BRIS with other BRIS markets over the sample period. Graph (e) shows the average BRIS ADCC values. (iii) The crisis period has also been highlighted, reflected by the shaded region in each graph.(iv): x-axis represents year, y-axis represents average ADCC values.
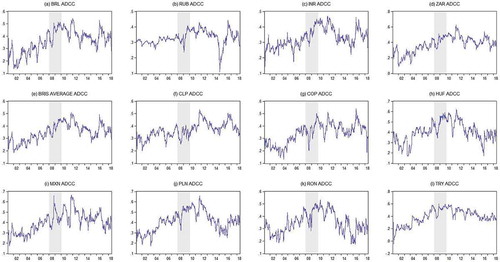
Table 4. Return and volatility spillovers for all sample currency markets
Table 5. Block aggregation approach under Diebold–Yilmaz results of currency markets
Figure 2. Dynamic total spillovers for the entire sample EMEs (currency markets).
Notes: (i) The graph in the figure shows dynamic total spillovers for all the sample EMEs including BRIS for the entire period of study.(ii) Dynamic spillover index is obtained using 250-week rolling window for estimation and 10-week forecast period.(iii) Crisis period is highlighted, reflected by the shaded region.(iv): x-axis represents year, y-axis represents total spillover (%).
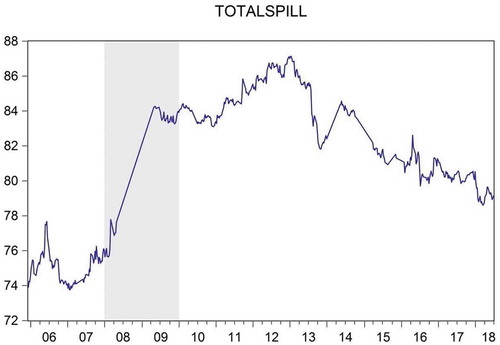
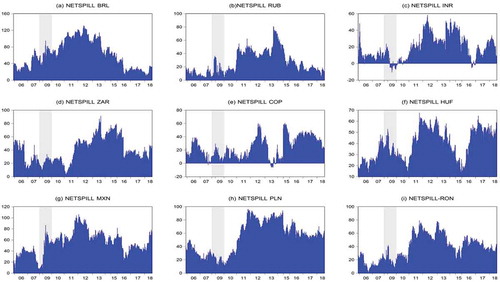
Figure 3. Dynamic net spillovers for select emes including BRIS (currency markets).
Notes: (i) The graphs in the figure show dynamic net spillovers for only those EMEs that have high gross spillover (BRIS) values and a positive net spillover (BRIS) with all the sample EMEs including BRICS for the entire period of study. (ii) Figures (a) to (d) represent BRIS, (e) to (i) represent COP, HUF, MXN, PLN and RON, respectively.(iii) Dynamic spillover index is obtained using 250-week rolling window for estimation and 10-week forecast period.(iv) Crisis period has also been highlighted reflected by the shaded region in each graph.(v): x-axis represents year, y-axis represents net spillover (%).