
Figures & data
Figure 1. The Relative Strength Index
Notes: Figure shows that when RSI was below 30, the security has shifted from downtrend to uptrend and when it was above 70 the trend shifted the opposite way.
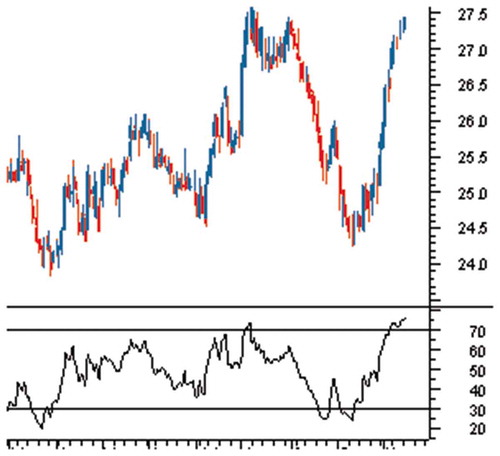
Table 1. Original RSI-based trading results
Table 2. Optimal RSI-based trading results
Table 3. RSI CMF-based trading strategies
Table 4. CCI-based trading strategies
Figure 2. Bollinger Band
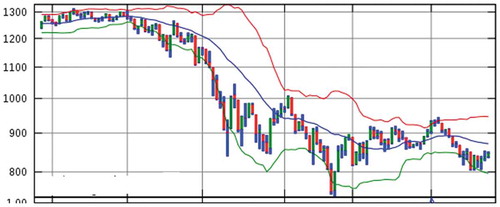
Table 5. Bollinger Bands-Based Trading Strategy Results