
Figures & data
Figure 2. NIIP/GDP Ratio
Source: Fiji Island Bureau of Statistics and International Financial Statistics (2018).
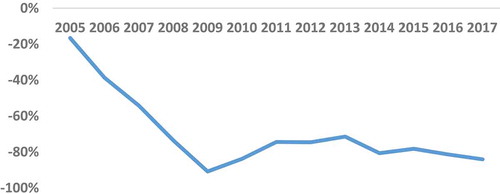
Table 1. Estimates of key parameters
Table 2. Distance and probability to default
Table 3. Comparative analysis of BSM and Naïve
Figure A1. Real GDP Growth (Annual Percentage Change)
Source: IMF: World economic outlook (October 2019)
Figure A2. General government debt (As percentage of GDP)
Source: IMF: World economic outlook (October 2019)
Data Sources
The sources of data are indicated in A2.