
Figures & data
Table 1. The information about the independent and dependent variables used in the analysis are given below
Figure 1. SMOTE algorithm (Synthetic data generation method)
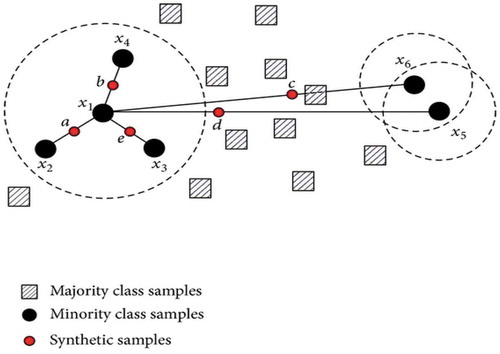
Figure 2. Ensemble learning method
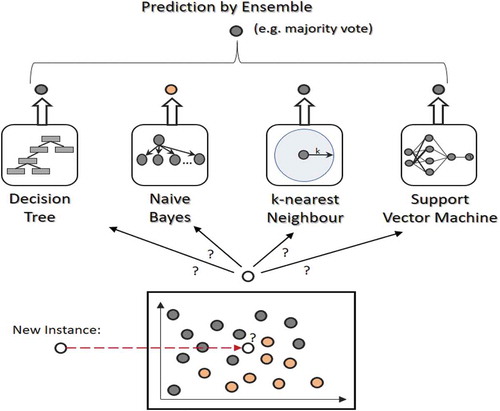
Figure 3. Bagging procedure for algorithm learning
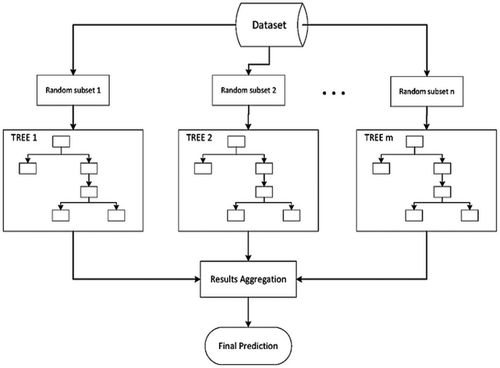
Table 2. Descriptive statistics for private and public sector Indian banks for the period of 2000–2017
Table 3. Preliminary data analysis the Table 3 describes the descriptive statistics of accounting profiles to survived vs. Failed banks. The t-tests on the mean difference for different classifications of banks are given below
Table 4. Confusion matrix—Actual values vs predicted results
Table 5. Actual vs predicted—logistic regression
Table 6. Actual vs predicted—random forest method
Table 7. Actual vs predicted—AdaBoost method
Table 8. Accuracy and Type-II error of the different algorithms on the test data