
Figures & data
Table 1. Descriptive statistics (1 January 2015–31 January 2019)
Figure 1. MVIS variation (1 January 2015–31 January 2019)
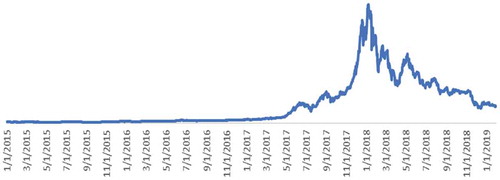
Figure 2. MVIS variation (1 January 2015–2 January 2016)
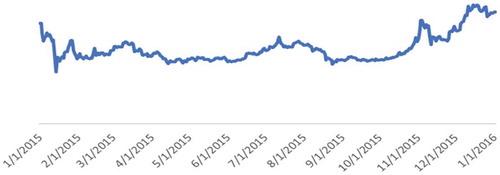
Figure 3. MVIS variation (3 January 2016–28 February 2017)
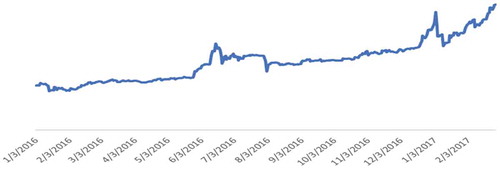
Figure 4. MVIS variation (1 March 2017–31 January 2019)
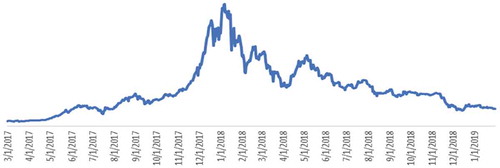
Table 2. Regression results of CSADt
Figure 5. Scatterplot of EquationEquation (3)(3)
(3) estimation’s residuals
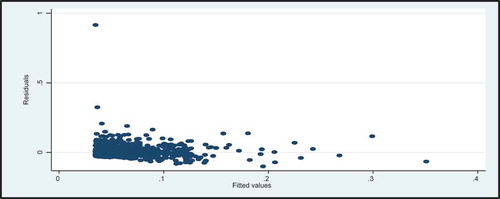
Table 3. BDS test
Figure 6. The coefficient based on rolling window (30 observations)
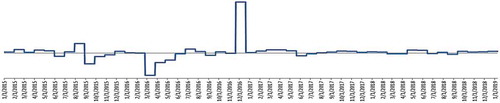
Figure 7. T-statistics based on rolling window (30 observations) and 5% critical value
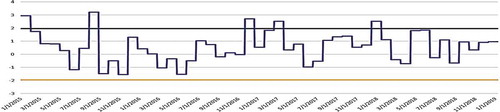
Table 4. Herding periods
Table 5. Estimation of logistic model
Table 6. Estimation of logistic model