Figures & data
Table 1. Sample of accounts used
Table 2. Calculated frequencies from sample data
Figure 1. Four monthly marginal probabilities for an unsecured loan portfolio
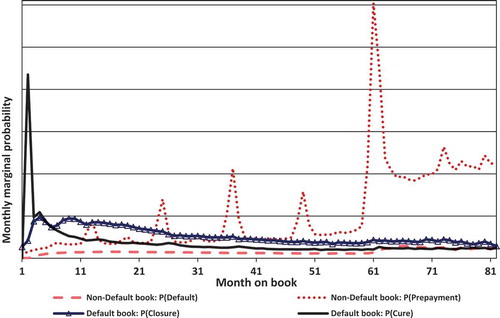
Figure 2. Term structure of the PD for an unsecured loan portfolio
Figure 3. Term structure of the PD based on different segmentations for an unsecured loan portfolio
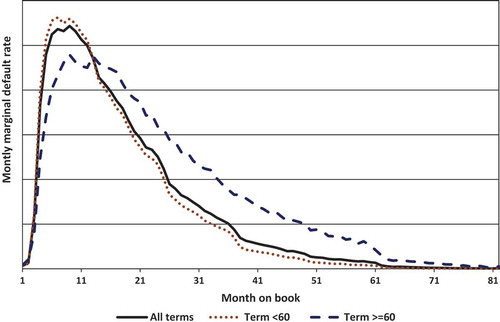
Table 3. Representation of recovery data
Figure 4. Actual LGD by month on book for the unsecured loan portfolio
Figure 5. Recovery rates per monthly vintage
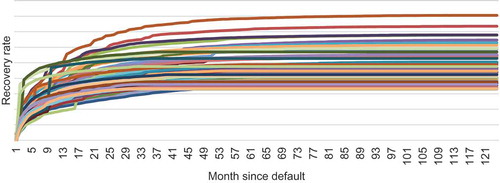
Figure 6. LGD per month on book
Figure 7. Test sample accounts by contractual term of loan
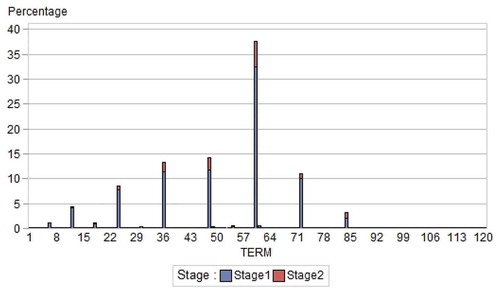
Figure 8. Test sample accounts by month on book
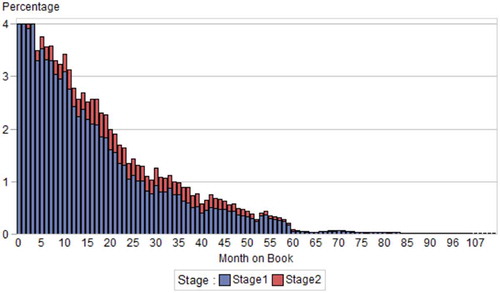
Figure 9. Average PD term structure per month on book
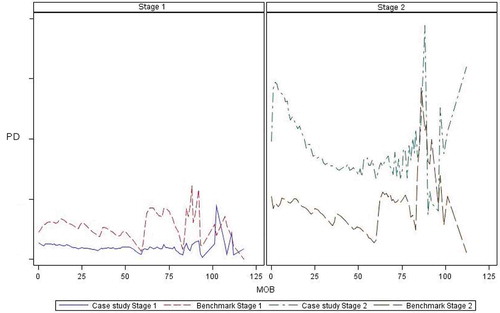
Figure 10. Average PD term structure per month on book and per term
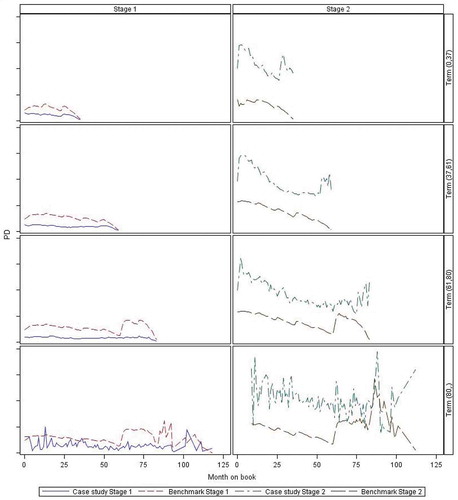
Figure 11. Distribution of PDs per stage and term
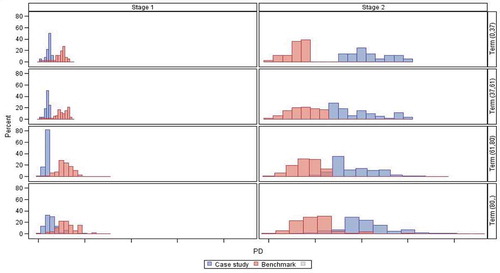
Figure 12. LGD comparison
Table 4. ECL comparison
Table 5. Exposure weighted 12-month PDs as percentage of bad rate
Figure 13. PD term structure for different reference periods
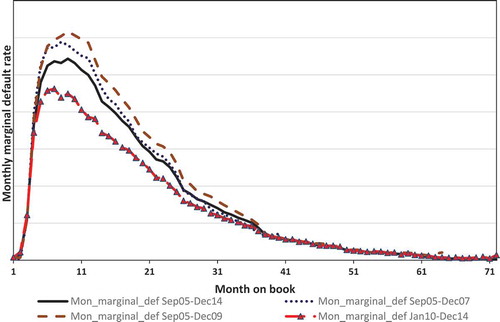
Table 6. Summary of case study PD and benchmark PD
Figure 14. Benchmark PD term structure
Figure 15. Stage 1 ECL comparison
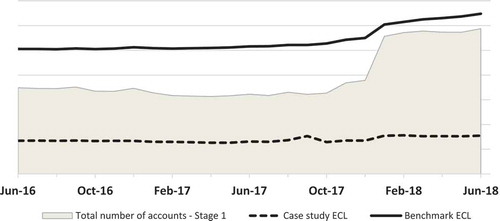
Figure 16. Stage 2 ECL comparison
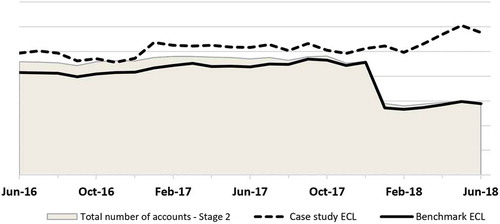
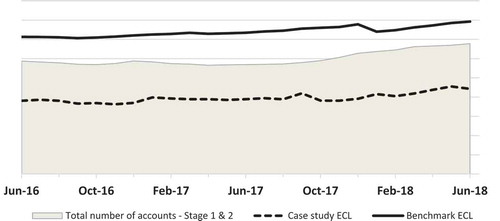
Figure 17. Aggregate of Stage 1 and Stage 2 ECL comparison