
Figures & data
Figure 1. Panel A shows the relationship between board size and FII ownership quartiles
Each year, observations are sorted into quartiles based on FII ownership percentages.Quartile 1 represents the lowest percentage holdings and quartile 4 represents the highest. Board size is measured as the total number of directors during a year. Panel B shows the relationship between number of independent directors and FII ownership quartiles.
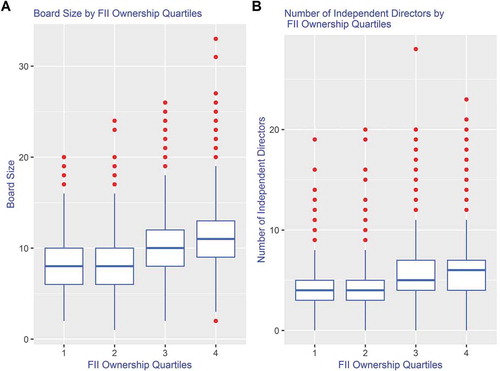
Table A1. Descriptive Statistics of Institutional and Promoter Ownerships
Table A2. Summary Statistics the Independent Variables
Table A3. Frequency Distribution of Fii Ownership and Summary Statistics by Year
Table A4. Regression Results for Fii Ownership and Board Characteristics