Figures & data
Figure 1. Daily spot exchange rate of the rand against the US dollar from 1 October 2009 to 28 February 2017
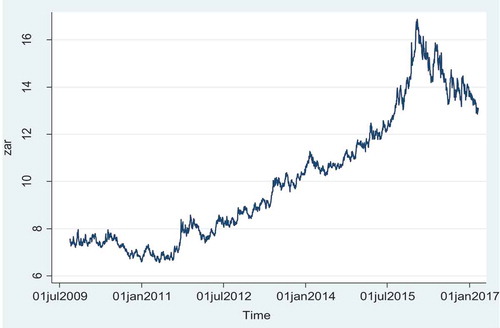
Figure 2. Daily spot exchange rate of the euro against the US dollar from 1 October 2009 to 28 February 2017
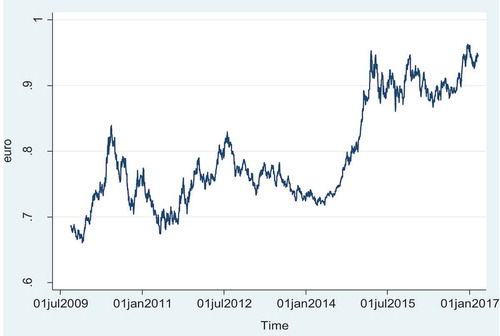
Figure 3. Daily changes in logarithmic exchange returns for the rand against the US dollar
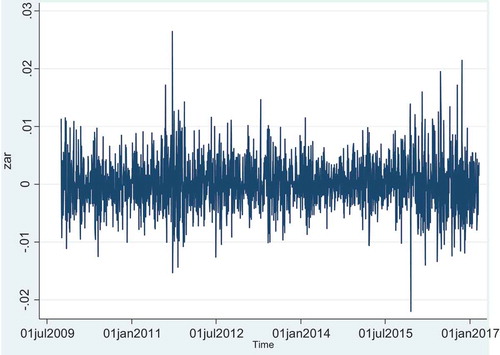
Figure 4. Daily changes in logarithmic exchange returns for the euro against the US dollar
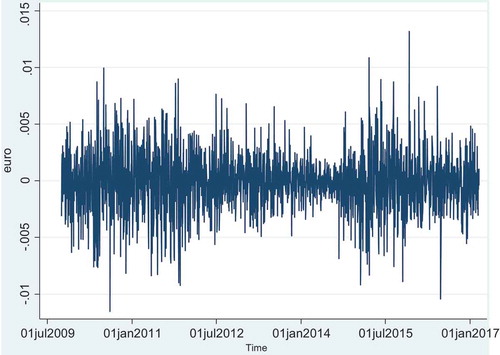
Table 1. Summary statistics
Figure 5. Density histogram and QQ plot under the Gaussian normal distribution assumption for the yield of the rand versus the US dollar
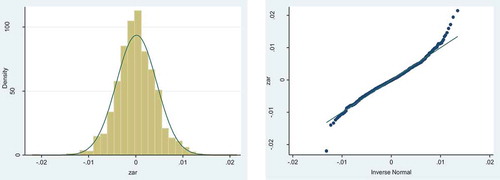
Figure 6. Density histogram and QQ plot under the Gaussian normal distribution assumption for the yield of the euro versus the US dollar
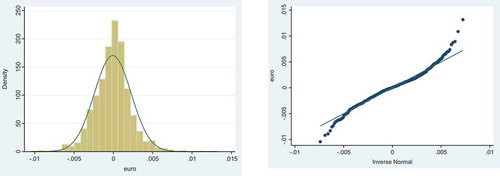
Table 2. Summary of the BEKK-GARCH model parameter estimates for the rand and euro during the crisis period
Table 3. Summary of the BEKK-GARCH model parameter estimates for the rand and euro during the post-crisis period
Table 4. Summary of parameter estimates for the DCC model during the crisis period
Table 5. Summary of parameter estimates for the t-DCC model during the crisis period
Table 6. Summary of parameter estimates for the DCC model during the post-crisis period
Table 7. Summary of parameter estimates for the t-DCC model during the post-crisis period
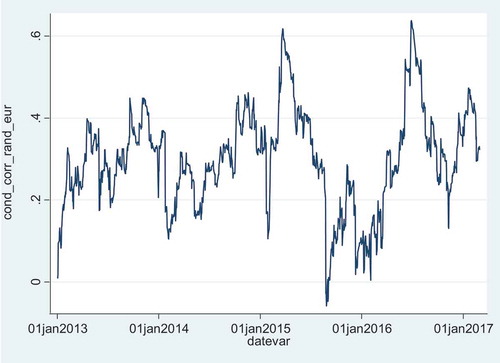
Figure 7. Conditional correlation between the rand and euro during the crisis period
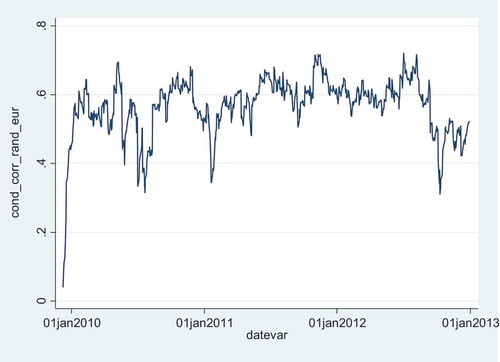
Figure 8. Conditional correlation between the rand and euro during the post-crisis period