
Figures & data
Figure 1. Financial distress continuum
Source: Author adapted from Cybinski (Citation2001) and Corporate Renewal Solutions (Citation2009)
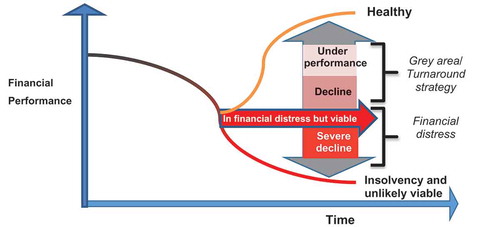
Figure 2. Process of a financially distressed company
Source: Adapted from Corporate Renewal Solutions, Citation2009
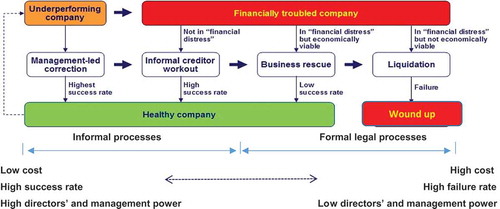
Figure 3. Liquidations over the last 12 years
Source: Compiled by the author using data from SA Stats, Citation2017
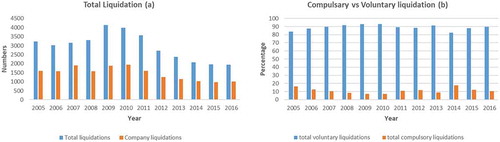
Table 1. Sample of listed and delisted firms
Table 2. Definition of variables used in the K-score model
Table 3. Descriptive statistics
Table 4. K-scores across sectors
Figure 4. Analysis of K-score variables across the entire sample
Source: Author
Table 5. Pearson correlation matrix
Table 6. OLS and random effects results