
Figures & data
Table 1. Overview of the Indian Capital Markets (National Stock Exchange of India)
Table 2. Net FII and net DII investment flows in India
Table 3. Descriptive statistics
Table 4. Correlation analysis
Figure 1. Net FII and net DII investment flows in India
This figure shows the daily net FII and net DII investment flows from 2007–2017. We have marked the event study window to help analyze the change in trends. The figure indicates a negative correlation between net FII flows and net DII flows. (Source: National Stock Exchange of India, author calculation)
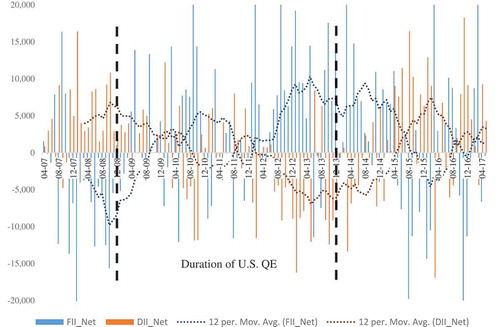
Table 5. Test of Granger causality between returns and flows using U.S. QE event window
Table 6. Test of Granger causality between returns and flows using global financial crisis event window