
Figures & data
Figure 1. The trend of economic growth (GDP) and trade openness (TOP) in India over the period 1960–2018.
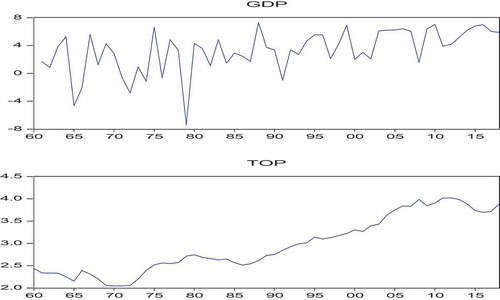
Table 1. Covariance and correlation matrix
Table 2. Descriptive statistics and unit root test of the variables
Table 3. Unit root test in the presence of two-time structural break (AO)
Figure 2. Clemente, Montanes, and Reyes (CMR) (Citation1998) unit roots in the presence of a one-time structural break for economic growth (GDP) and trade openness (TOP) during the period 1960–2018.
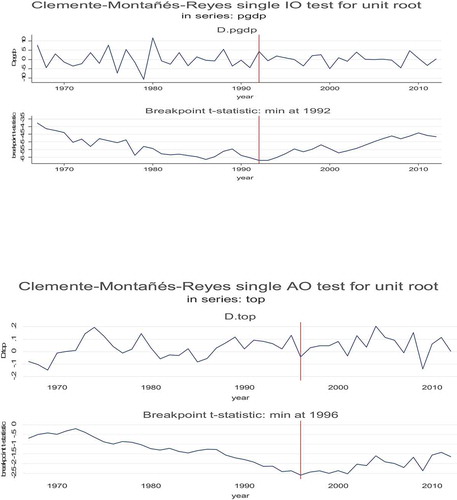
Figure 3. Clemente, Montanes, and Reyes (CMR) (Citation1998) unit roots in the presence of a two-time structural break for economic growth (GDP) and trade openness (TOP) during the period 1960–2018.
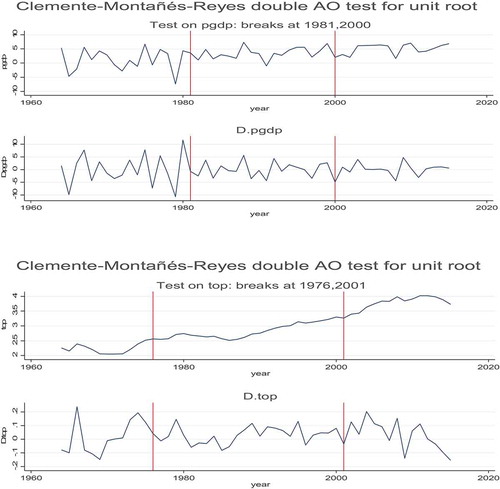
Figure 4. The threshold value of the TAR model during the period 1960–2018.
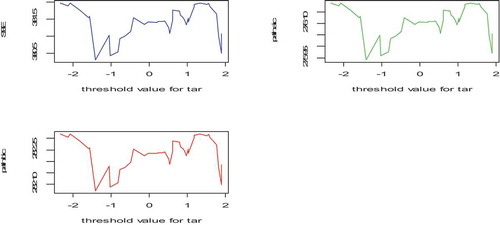
Figure 5. The threshold value of the M-TAR model during the period 1960–2018.
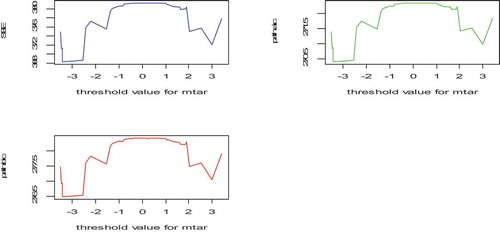
Table 4. Results of Engle-Granger and threshold cointegration tests during the period 1960–2018
Table 5. Results of the asymmetric error correction model with threshold cointegration during the period 1960–2018
Table 6. Results of Engle-Granger and threshold cointegration tests during the pre-reforms period 1960–1990
Table 7. Results of Engle-Granger and threshold cointegration tests during the post-reforms period 1991–2018
Figure 6. The threshold value of the TAR model during the pre-reforms period 1960–1990.
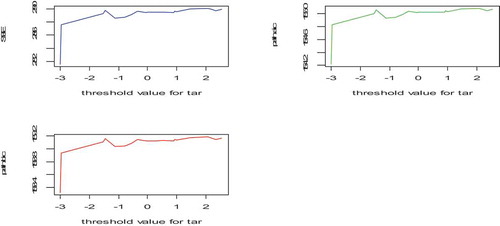
Figure 7. The threshold value of the M-TAR model during the pre-reforms period 1960–1990.
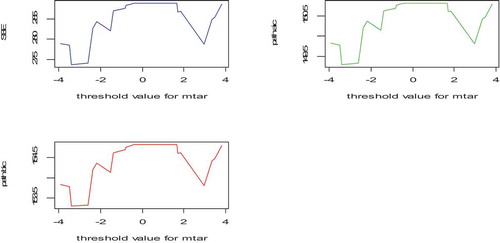
Figure 8. The threshold value of the TAR model during the post-reforms period 1991–2018.
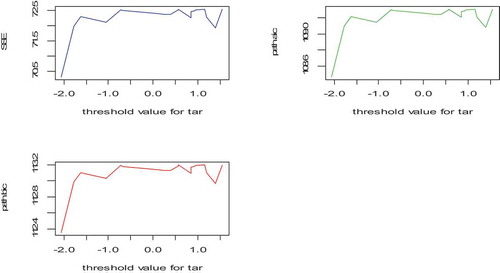
Figure 9. The threshold value of the M-TAR model during the post-reforms period 1991–2018.
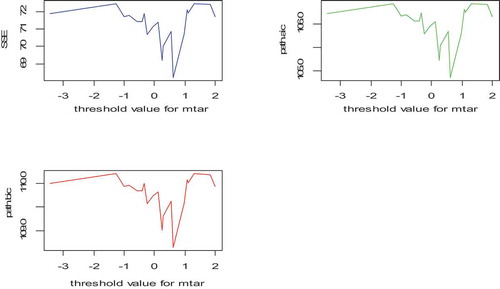
Table 8. Results of the asymmetric error correction model with threshold cointegration during the pre-reforms period 1960–1990
Table 9. Results of the asymmetric error correction model with threshold cointegration during the post-reforms period 1991–2018