Figures & data
Figure 1. Scatter Plot of U.S. corn exports to its trading partners (1000 metric tons), (1967–2016).
Figure 2. Trends in Corn Export by US, Brazil, Ukraine, and Argentina (1000 MT).
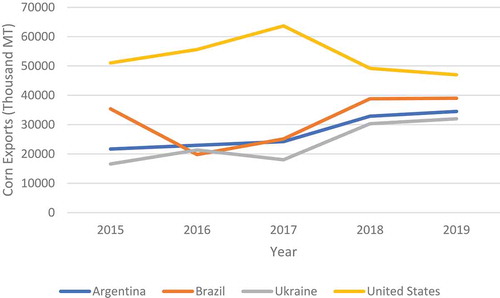
Table 1. Summary Statistics
Table 2. Unit Roots test (Intercept Only)
Table 3. Unit Roots test (Intercept and Trend)
Figure 3. Plot of Variables in Levels (1967–2016).
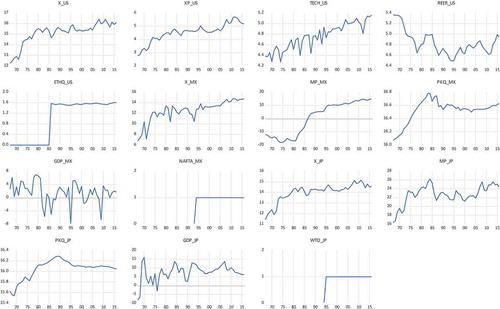
Figure 4. Plot of Variables in Levels (1967–2016).
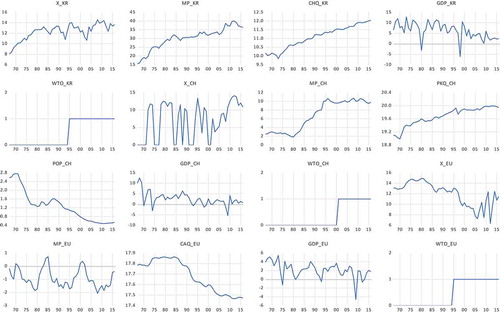
Figure 5. Trends in US Corn Exports to Major Importers (1000 metric tons).
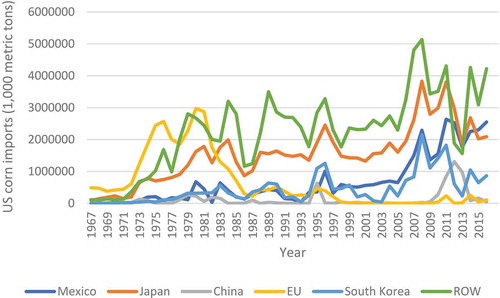
Table 4. Test of Long Run relationship
Table 5. US Corn Export Model: ARDL (Long-Run) Estimates
Table 6. US Corn Export: Error Correction Model (Short-Run)
Table 7. Corn Import Model: ARDL Estimates
Table 8. Error Correction Model (Short-Run) Estimates
Table 9. Results of Diagnostic tests