
Figures & data
Figure 1. Dynamics of FDI (in percentage of GDP) in WAEMU and the rest of the world (1980–2017).
Source: Authors, using data from WDI (Citation2019).
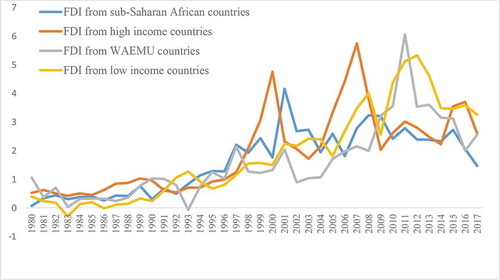
Figure 2. Dynamics of the major sectors of the economy (percentage of GDP) in the WAEMU (1997–2017).
Source: Authors from WDI (Citation2019).
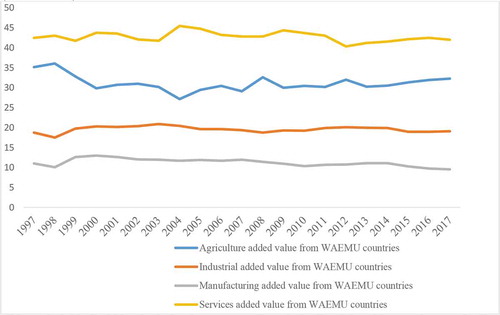
Table 1. Variables, definitions, and sources
Table 2. Descriptive statistics
Table 3. Unit roots test
Table 4. Correlation and multicollinearity tests (industry sector)
Table 5. Correlation and multicollinearity tests (Agriculture sector)
Table 6. Correlation and multicollinearity tests (Services sector)
Table 7. Regressions for industry and manufacturing sectors
Table 8. Regressions for agriculture and service sectors