
Figures & data
Figure 1. Evolution of sources of revenue, 1973–2016.
Source: Ministry of Finance and Economic Development—Financial Statement of the Consolidated Fund, 2017.
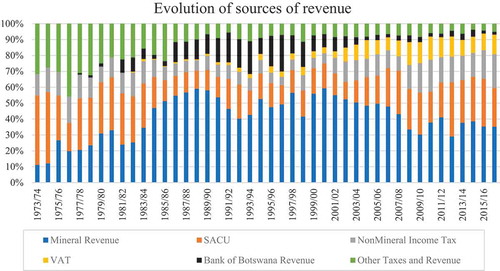
Figure 2. Real GDP Growth (%), 1995–2017.
Source: Statistics Botswana—Gross Domestic Product Quarter 3, 2018.
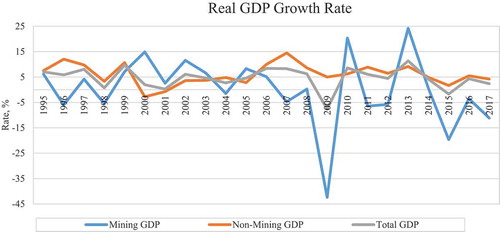
Table 1. Steady state values
Table 2. Baseline calibration
Figure 3. Impact of consumption tax cut in response to a persistent mining productivity shock.
Source: Author’s computation.
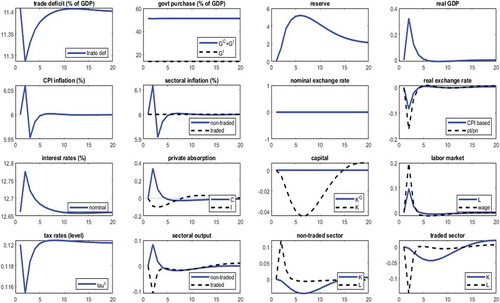
Figure 4. Impact of labour tax cut in response to a persistent mining productivity shock.
Source: Author’s computation.
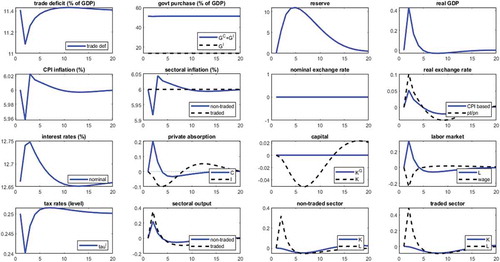
Figure 5. Impact of an increase in government investment in response to a persistent mining productivity shock.
Source: Author’s computation.
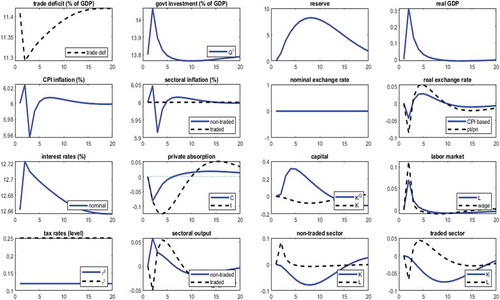
Figure 6. Impact of an increase in government consumption in response to a persistent mining productivity shock.
Source: Author’s computation.
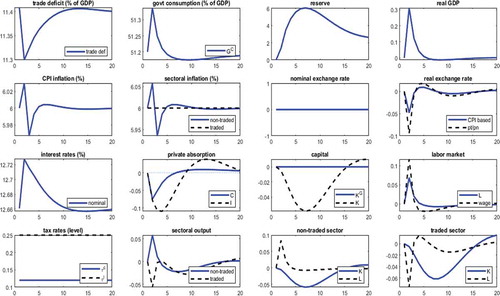
Table 3. Multipliers across different fiscal stimulus instruments