3,490
Views
4
CrossRef citations to date
0
Altmetric
GENERAL & APPLIED ECONOMICS

Modelling the oil price volatility and macroeconomic variables in South Africa using the symmetric and asymmetric GARCH models

, & | (Reviewing editor)
Article: 1792153 | Received 15 Apr 2020, Accepted 30 Jun 2020, Published online: 13 Jul 2020

Figures & data

Table 1. Descriptive statistics results

Figure 1. Time series plots at level.

Figure 1. Time series plots at level.

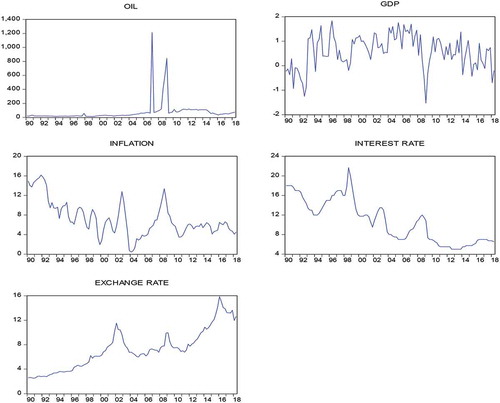
Table 2. Stationarity test results

Figure 2. Residual time series plots.

Figure 2. Residual time series plots.

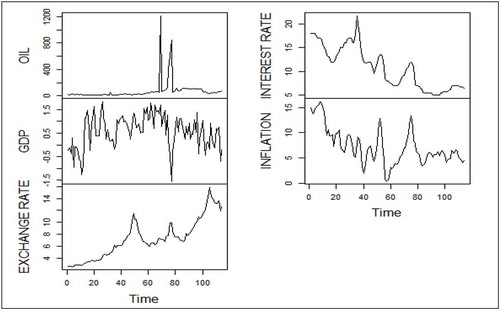
Table 3. Parameter estimation results of the ARCH model

Table 4. Parameter estimation results of the GARCH and EGARCH model

Table 5. Diagnostic test results