
Figures & data
Table 1. Copula functions and its characteristics
Table 2. Copula Parameters
Table 3. Descriptive Statistics of Returns of Daily Stocks and World Crude Oil
Figure 1. Normal q-q plots of returns of stock indices for period 1.
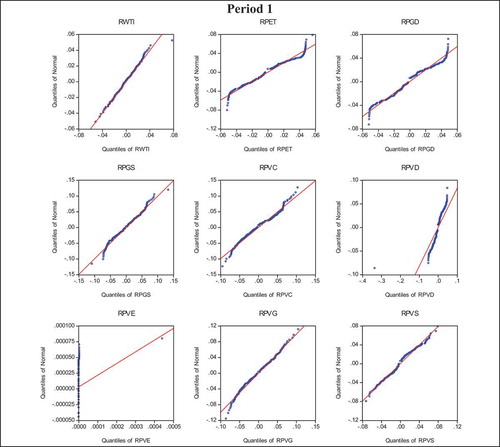
Figure 2. Normal q-q plots of returns of stock indices for period 2.
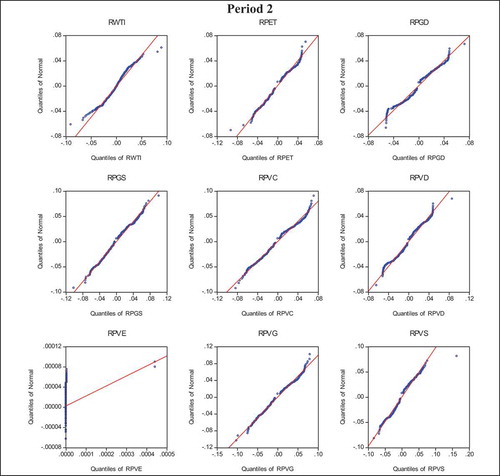
Figure 3. Normal q-q plots of returns of stock indices for period 3.
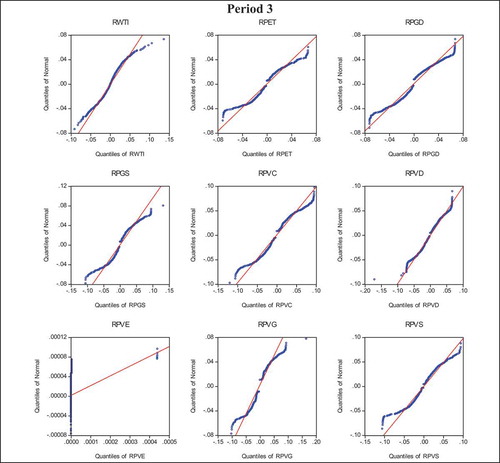
Table 4. Dependence coefficient of WCOR and SR in pre-depression period
Table 5. Dependence coefficient of WCOR and SR in depression period
Table 6. Dependence coefficient of WCOR and SR in post- depression period
Figure 4. DCs between WCOR and SR in three periods.
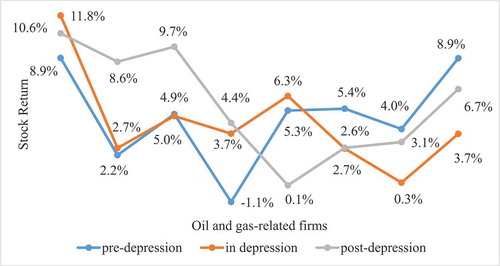
Table 7. Estimation of copula parameters for WCOR and PVD in pre-depression period and best copula
Table 8. Estimation of copula parameters for WCOR and PVD in depression period and best copula
Table 9. Estimation of copula parameters for WCOR and PVD in post- depression period and best copula
Table 10. The choice of the best copula for WCOR and Vietnam’s oil and gas stock returns, and tail dependence coefficients in each period
Table 11. Granger Causality Test