Figures & data
Figure 1. Variables in their levels
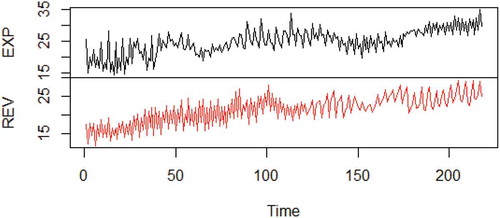
Figure 2. Variables in their first difference
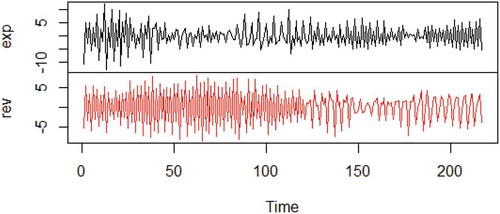
Table 1. Stationary test results
Table 2. Cointegration test results
Figure 3. SVAR variance decomposition.
Table 3. Linear granger causality test results
Figure 4. Local linear autoregressive plot of expenditure.
Figure 5. RMSE of local linear fit of expenditure.
Figure 6. Local linear autoregressive plot of revenue.
Figure 7. RMSE of local linear fit of revenue.
Table 4. BDS nonlinearity test
Table 5. Mcleod–Li test nonlinearity test
Table 6. Noninear Granger causality test results
Table 7. LR test
Figure 8. Threshold value results of the grid search procedure.
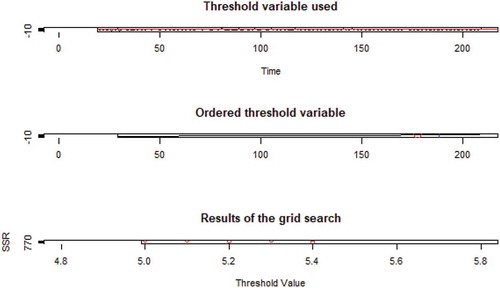
Table 8. TVAR results test
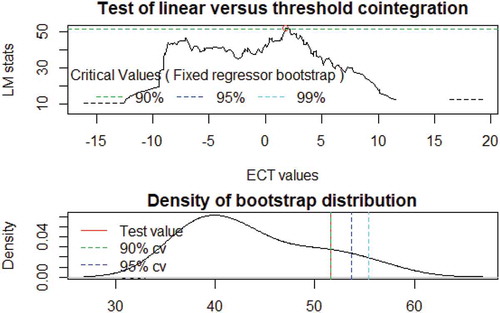
Figure 9. Hansen and Seo co-integration plot.
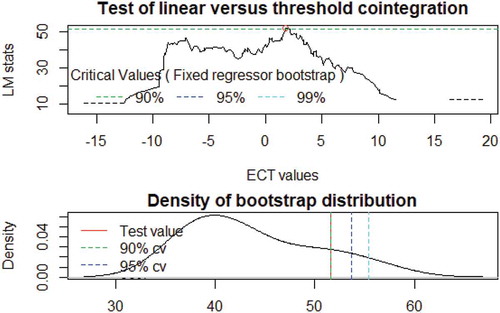
Table 9. Hansen and Seo threshold co-integration
Table 10. TVECM results test
Figure 10. Smoothened probabilities for government expenditure.
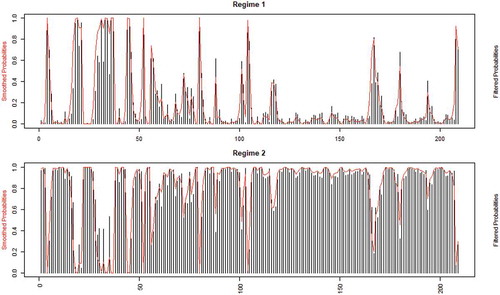
Figure 11. Smoothened probabilities for government expenditure.
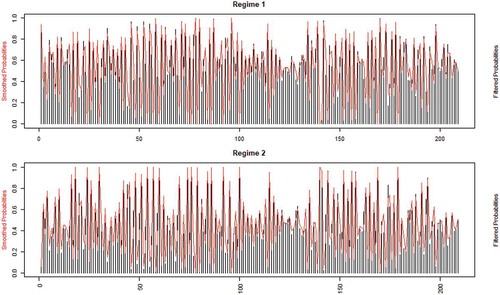
Table 11. Markov switching probabilities