
Figures & data
Figure 1. Psycho-social economic equation of deposit-taking SACCOs hypothetical economy.
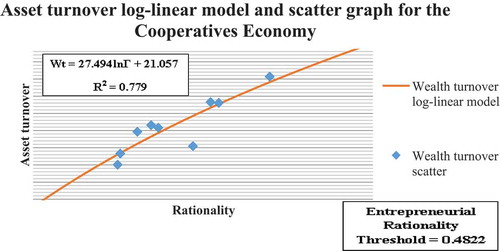
Table 1. Asset turnover from data by the psychosocial economic equation—model
Table 2. Levene’s test of homogeneity of variance between data and turnover model
Table 3. Wilcoxon, Friedman and Kendall’s tests between data and the asset turnover model
Figure 2. Psychosocial economic equations of various economic fertilities.
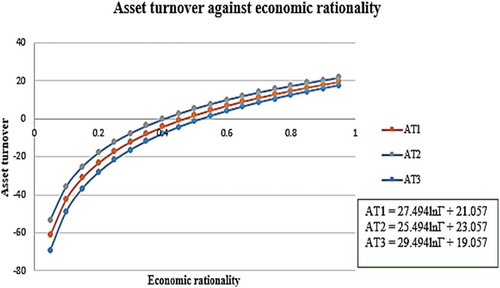
Table 4. Income tax graduated scale rates 2019 individual tax bands and rates
Table 5. Differential and progressivity model tax liability
Table 6. Levene’s test of homogeneity of variance between data and tax liability model
Table 7. Wilcoxon, Friedman and Kendall’s Test between data and the tax liability model
Table 8. Cogni-economic pressure coefficient adjusted tax liability sector-wise
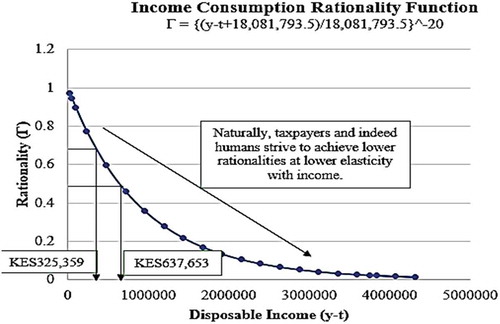
Figure 3. Income consumption rationality function.
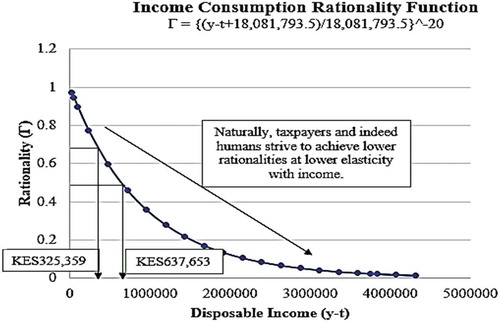
Table 9. Annual disposable income and rationality
Figure 4. Kenya’s consumption proportion of GDP 2006–2016 in percentage.
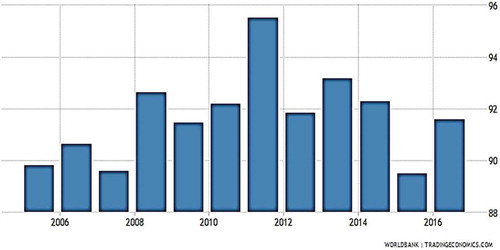
Figure 5. Salary income distribution in 2019.
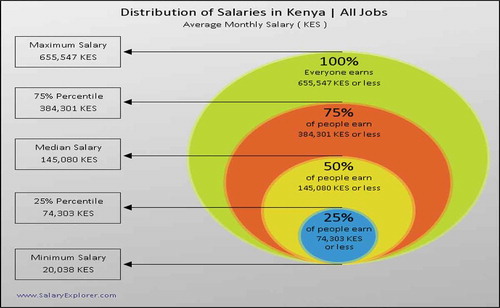
Table 10. Current Tax and CPC tax comparatives
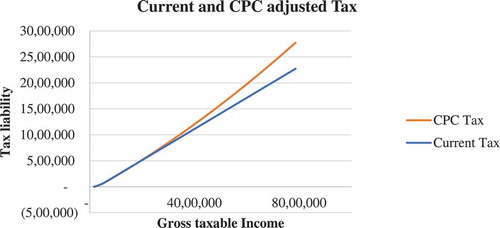
Figure 6. Current tax and CPC adjusted tax continuous progressivity functions.
Appendix B. Operational data summary