Figures & data
Figure 1. Share of the oil, non-oil sector and national savings (% of GDP).
Source: Authors’ computation and data from CBN Statistical Bulletin (2018).
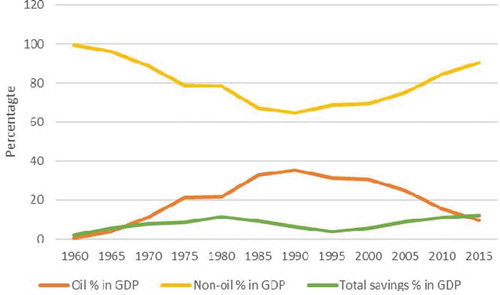
Table 1. List of variables
Table 2. Eigenvalues, proportion and eigenvectors of each first principal component
Table 3. Correlation matrix
Table 4. Zivot-Andrews unit root test
Table 5. ARDL bounds co-integration test result
Table 6. Estimated long run coefficients using ARDL approach
Table 7. Short-run error correction estimates
Table 8. ARDL-VECM model diagnostic tests
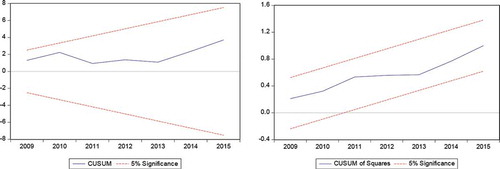
Figure 2. Plot of CUSUM and CUSUMSQ for coefficient stability for ECM model (1).
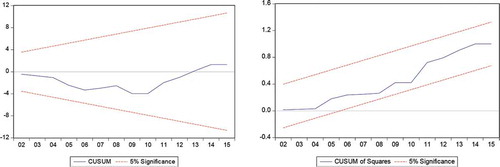
Figure 3. Plot of CUSUM and CUSUMSQ for coefficient stability for ECM model (2).