
Figures & data
Table 1. Crude oil price and value-weighted return of oil and gas extractives firms
Figure 1. Crude oil price and market capitalization of oil and gas extractives firms
The left axis of the chart indicates the daily level of the aggregated market capitalizations (in billions of dollars) consisting of the firms in the oil and gas extraction sub-sector between January 2008 and December 2019. Market capitalization for each firm is determined as the number of common shares outstanding multiplied by the share price. The right axis indicates the daily price level (in dollars) of the nearest-to-delivery NYMEX/WTI futures contract during the same period.
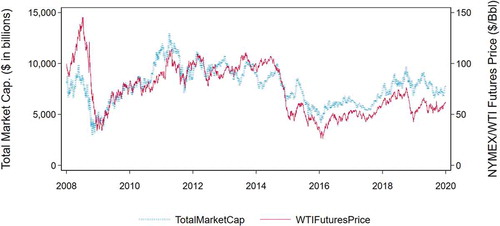
Table 2. Summary of firm-specific characteristics by group
Table 3. Correlations and variance inflation factors of firm characteristics
Table 4. Unit root tests on crude oil futures prices, S&P 500 index, and select stocks
Table 5. Firm characteristics and stock sensitivity to oil price returns (2007–2019)
Table 6. Firm characteristics and stock sensitivity to oil price returns (2007–2009)
Table 7. Firm characteristics and lagged effect of oil prices to stock returns (2007–2019)